Fig. 3.
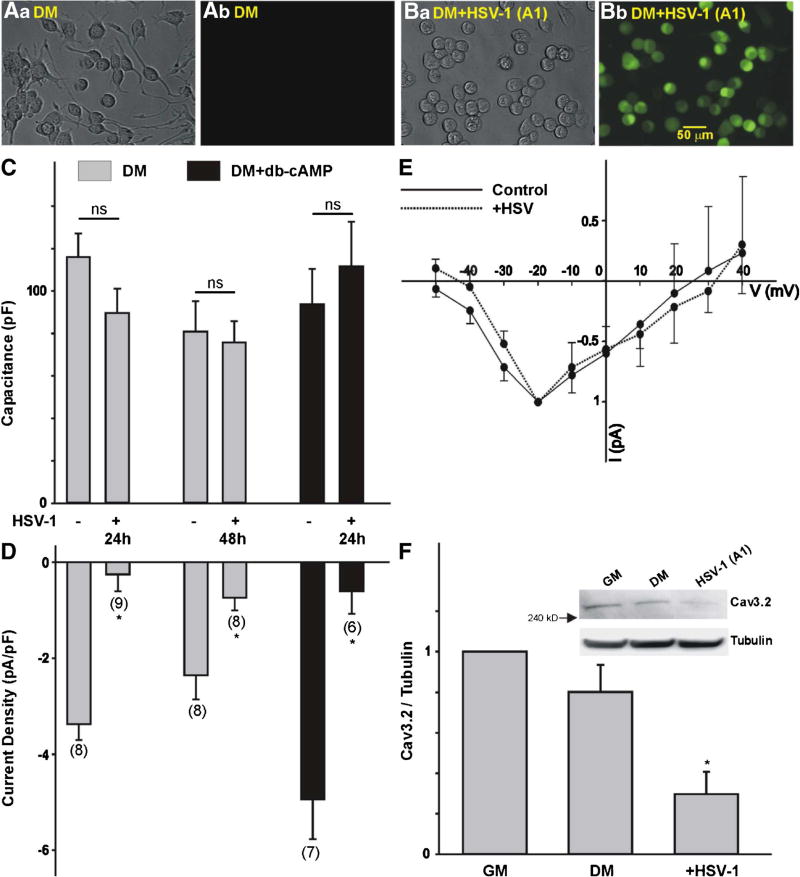
Effect of HSV-1 infection on T-type Ca2+ channel expression in differentiated ND7-23 cells. A, B Phase contrast (Aa, Ba) and GFP fluorescence (Ab, Bb) images of differentiated ND7-23 cells following HSV-1 infection. Differentiated ND7-23 cells express GFP fluorescence following overnight infection with HSV-1 (Bb) but not in non-infected cells (Ab). C Comparison of cell capacitance in ND7-23 cells before and after HSV-1 infection. Note that infection of differentiated ND7-23 cells had no effect on cell capacitance. ND7-23 cells were cultured for ~10 days with differentiation media (DM) alone or supplemented with db-cAMP (1 mM). After induction of cell differentiation, cells were infected with HSV-1 for 1 h. After this time period, viral particles were removed by washing with fresh media and cells were maintained for up to 48 h before performing whole cell recording of Ca2+ currents. D Infection of differentiated ND7-23 cells with HSV-1 causes a significant reduction in T-type Ca2+ current densities under all conditions tested. E Current-voltage (I–V) relationship for the peak current amplitude generated by a voltage step to −20 mV in ND7-23 cells before and after infection with HSV-1 for 24 h. F Changes in the expression of the Cav3.2 T-type Ca2+ channel subunit as determined by densitometry analysis (*p < 0.05 vs. non-infected cells grown in differentiation media (DM), n = 5). Inset: Representative example of western blot data collected from ND7-23 cells following infection with HSV-1. To confirm equal loading, membranes were stripped following Cav3.2 immunoblot and reprobed for tubulin. The ratio of Cav3.2 to tubulin was used to assess changes in Cav3.2 expression by densitometry analysis

