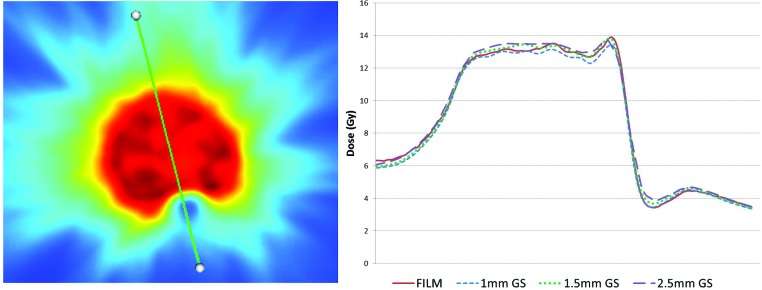
Figure 4.
Dose distribution (left) with line profile through the cord. Corresponding line profile of the film (red), 1mm GS (blue), 1.5mm GS (green dash), and 2.5mm GS (purple) demonstrating the agreement between the film and the dose distribution in the high dose gradient between the cord and the PTV and the PTV high dose region.

