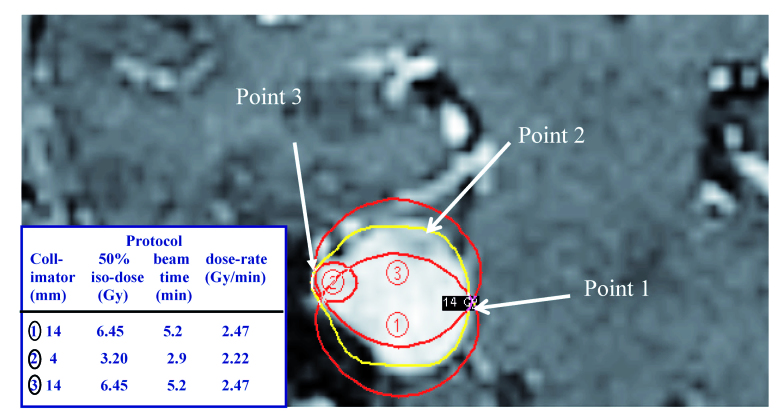
Figure 1.
MR image showing the location of the 50% iso-dose lines for the three iso-centers used in the of the contrast enhanced tumor (red lines). The resultant 50% prescription iso-dose (yellow line) is also indicated; prescription dose 14 Gy. This also represented the maximum dose to the brain stem. The relative dose contributions of the prescription iso-dose will vary with location. The labels and arrows for ‘Point 1’, ‘Point 2’ and ‘Point 3’ are explained in the text.

