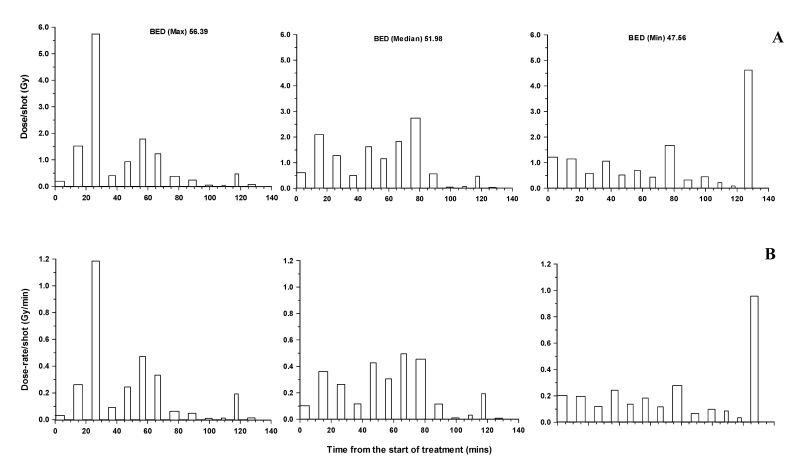
Figure 2.
Time related changes in dose contribution (A) from individual iso-centers (shots) and the associated dose-rate (B) for individual voxels on the 13 Gy iso-dose of a patient treated with a total of 13 iso-centers. The protocols for the voxels illustrated are those associated with the maximum, median and minimum BED values in the brain stem.

