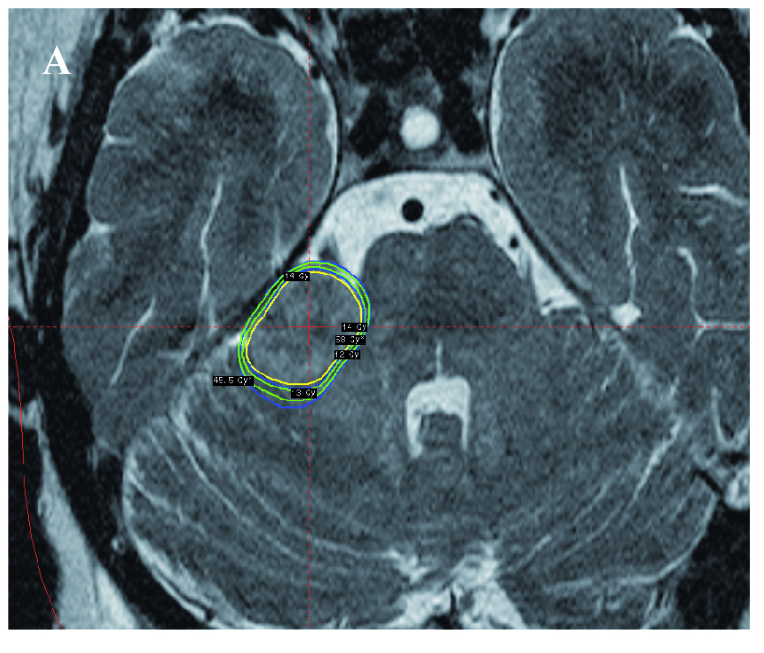
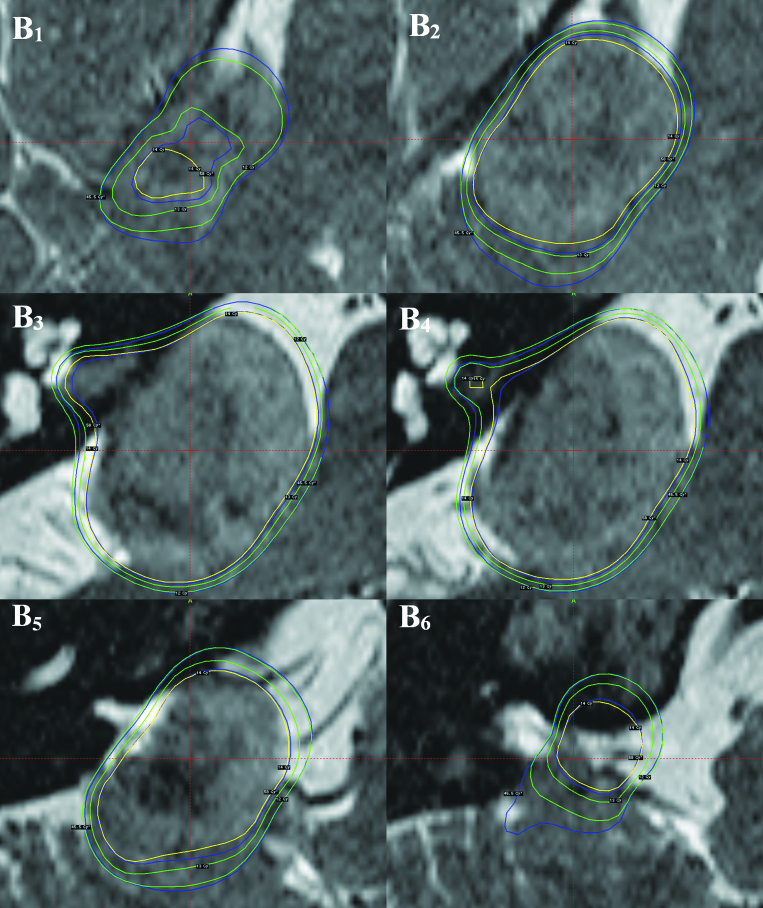
Figure 5.
Overview image, indicating the general location of a large Vestibular Schwannoma impinging on the brain stem (A) and representative detailed slices in the region of the target volume (B1-6), all images show the 14 Gy prescription physical iso-dose line (yellow) and the associated physical iso-dose lines of 13 and 12 Gy (inner and outer green lines, respectively). The two BED iso-dose lines with values of 58 and 45.5 are indicated for comparison (inner and outer blue lines, respectively). For further explanation see the text.


