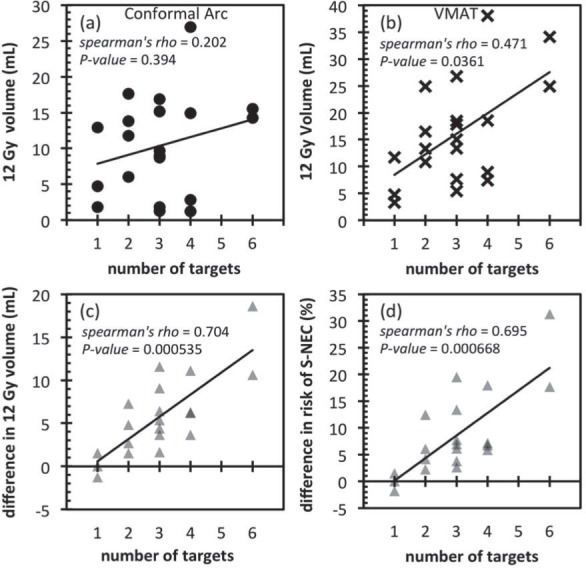
Figure 4.

12 Gy volume plotted against the number of targets for all patients for (a) conformal arc and (b) VMAT techniques. The difference in the 12 Gy volume and absolute risk of S-NEC between the two techniques is plotted in (c) and (d) respectively. Difference in the absolute risk of S-NEC between VMAT and conformal arc technique. A positive difference means that the VMAT absolute risk of S-NEC is higher.
