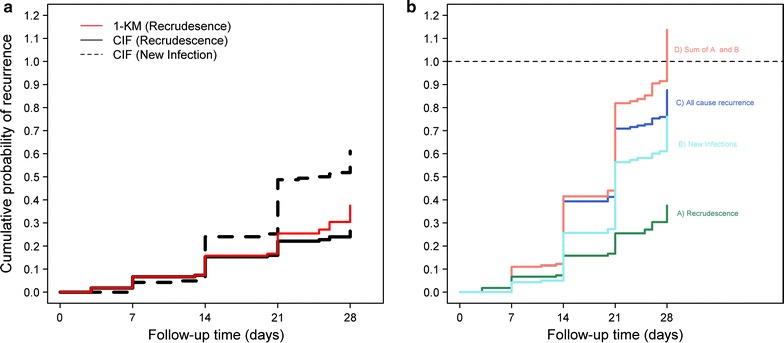
Fig. 4.

Overestimation of failure using complement of K–M method in Tororo dataset [25]. a Cumulative probability of failure due to recrudescence derived using Kaplan–Meier approach (red line) and using Cumulative Incidence Function (solid black line), which accounts for the presence of competing risks (dotted black line). b Estimates of the cumulative probability of recurrences for recrudescence (green), new infections (light blue) and overall recurrences (dark blue line) using K–M method. The sum of the probabilities for recrudescence and new infection is presented as the pink line and exceeds the value of 1 at 28 days of follow-up
