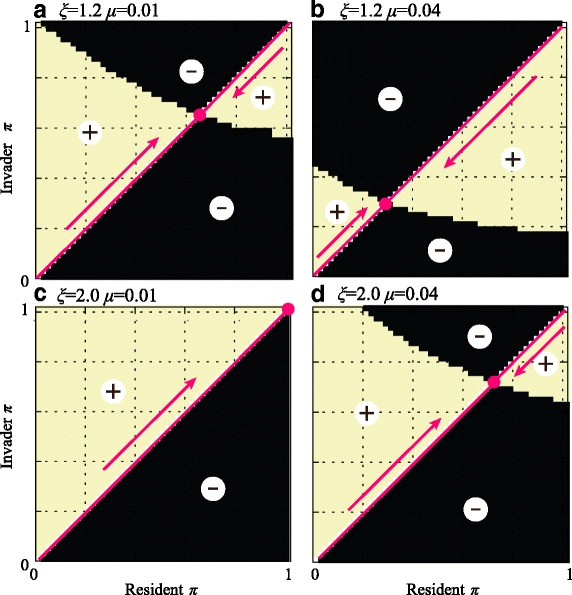
Fig. 5.

Pairwise invasibility plots for the paternally controlled mitochondrial inheritance. Values of paternal leakage π for which the invasion is successful are within the regions marked with “+”. Arrows show the direction of trait evolution, that is, the expected change in the value of π via recurrent invasion of mutants. a There is only one evolutionarily stable attractor at a singular point between π = 0 and π = 1. b Increasing the mutation rate favours an ESS with less paternal leakage (lower π), consistent with the need to purge deleterious mitochondrial mutations. c, d Increasing the degree of negative epistasis (higher ξ) increases the short-term benefit of mitochondrial mixing and favours higher levels of paternal leakage (higher π). The number of mitochondria was set to M = 50
