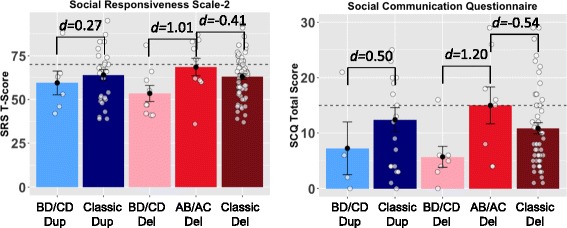
Fig. 3.

Individuals with deleted LCR-A to B show higher levels of autistic symptoms. This figure depicts group means, standard errors, and the effect size of differences on two quantitative measures of autistic symptoms, the Social Responsiveness Scale-2 and the Social Communication Scale, Lifetime. Each point depicts one individual. Dashed lines indicate the threshold above which an individual is considered to screen positive for autism and warrant further evaluation. The groups with involvement of LCR-A to B show higher levels of social impairment, with large effect sizes for deletions and small to medium effect sizes for duplications. Effect sizes are not significant due to small samples (see Table 4). The AB/AC deletion group includes five individuals diagnosed with autism; the BD/CD deletion group includes zero. Abbreviations: AB/AC deletion spanning LCR-A to LCR-B or LCR-A to LCR-C; BD/CD deletion or duplication spanning LCR-B to LCR-D or LCR-C to LCR-D; d Cohen’s d effect size; del deletion; dup duplication; LCR low-copy repeat region; SCQ Social Communication Questionnaire, Lifetime; SRS Social Responsiveness Scale
