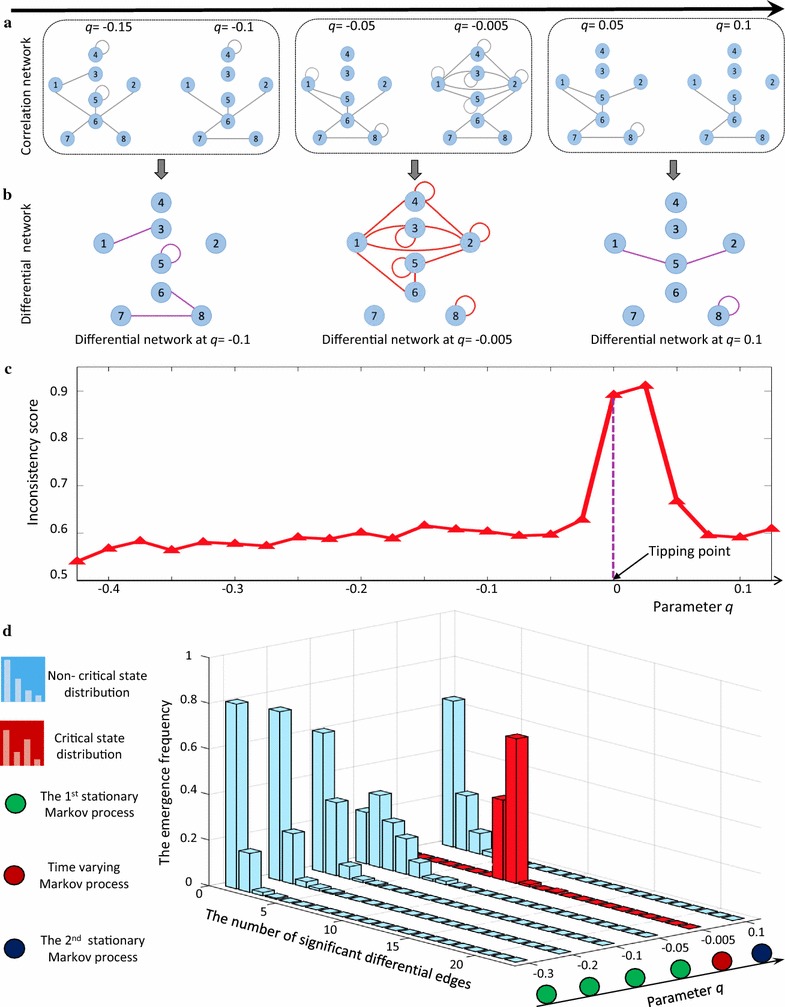
Fig. 2.

The validation of -score through a numerical experiment. To validate our method, the I-score scheme was performed on a simulated dataset from an eight-node network, whose detailed description is in Additional file 1: B. a The specific eight-node correlation networks respectively constructed along the sequence of parameter q. Among the 6 consequent networks, the first three (q = − 0.15, q = − 0.1 and q = 0.1) are in the normal state and no significant difference among them; the fourth (q = − 0.005) represents the transition state; and the last two (q = 0.05 and q = 0.1) locate in the disease state. b The construction of 3 differential networks based on adjacent specific networks. In each differential network, the edge connecting two nodes records temporal differential correlation, and the edge connecting only one node records temporal differential variance. c The I-scores of the network system. A boost of I-score signals the tipping point at q = 0, which agrees with the fact that the system undergoes a bifurcation at q = 0. d The distribution of the occurrence frequency of differential edges in the differential network. When parameter q is far from the critical value q = 0 (q = − 0.15, q = − 0.1), there are few differential edges (in statistical sense). However, when q approaches the bifurcation value q = 0 (q = − 0.005), the distribution changes considerably, i.e., the ratio of 13-differential-edges increases significantly
