Fig. 3.

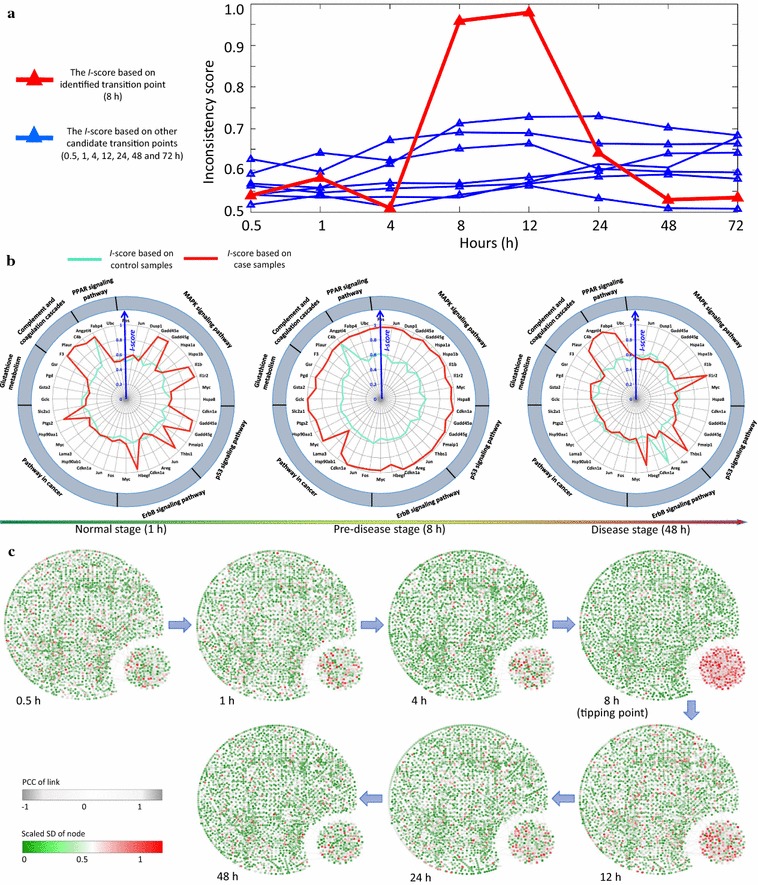
Application of -score on the microarray data of acute lung. a I-score curves based on the differential networks respectively constructed at each candidate critical time point. The red curve represents the I-score calculated from the testing differential network obtained at 8 h, and the seven blue curves are those derived from other candidate time points. The most significant signal appears at 8-hour point, which agrees with the experimental observation. b Radar plots present the dynamical change in I-scores of some local differential networks, which are labelled by their centre genes that enriched in pathways indicated outside. The red curve represents the I-score from case samples while the green curve is from the control data. At the pre-disease stage, the inconsistence is significant. c The dynamical evolution of the whole molecular network is shown respectively at 0.5, 1, 4, 8, 12, 24, and 48 h. The networks were constructed through a mapped whole mouse network. Node colour represents the fluctuation of expression, and the thickness of links represents the correlation between each pair of nodes. In the lower right corner of each network, there is a group of 189 genes with top 10% most significant I-scores’ change, which together show wild fluctuation in their expressions around 8 h
