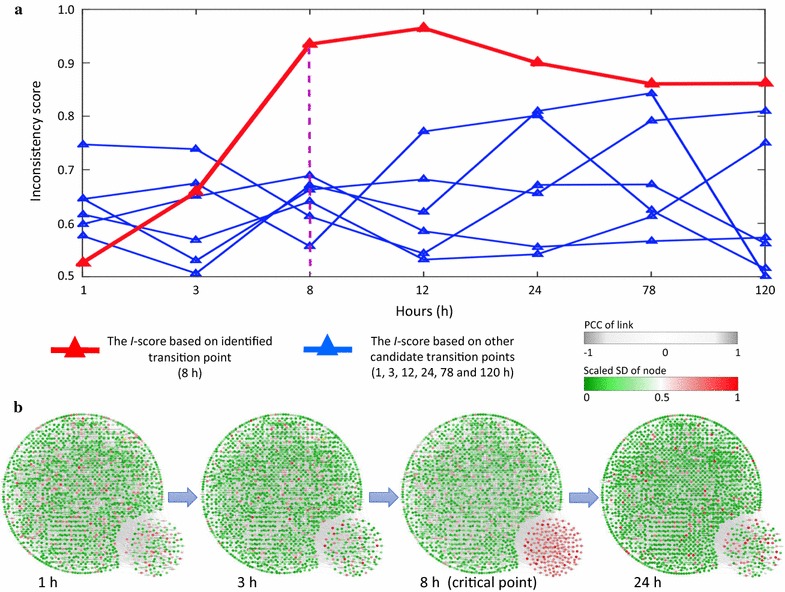
Fig. 5.

Application of -score on the dataset of acute corneal trauma. a The I-score based on microarray of acute corneal trauma from each candidate transition time point. The red curve represents the I-score calculated from the testing differential network obtained 8 h after acute corneal trauma, while the six blue curves are those from other time points. The abrupt increase of I-score appeared around the 1–8 h period, which is in coincidence with the experimental observation, i.e., the heat shock genes were upregulated beginning at 8 h, indicating the start of a stress response. b A group of 171 genes with top 10% most significant I-scores’ change are located in the lower-right corner in each network. These selected genes showed wild fluctuation in their expressions around the 8 h time point. Thus, the critical transition point was around 8 h, where the network structure exhibits the most significant change, just before the critical transition triggered by acute corneal trauma
