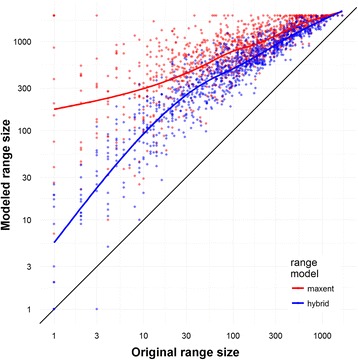
Fig. 7.

A graphical representation of the range-size expansion seen after modeling. The X-axis represents the number of cells in which specimens of an OTU occurred, and the Y-axis represents the number of cells in which they were projected to occur after modeling. Red represents the binary Maxent modeling, and blue represents the distance hybrid approach. The expansion is greater in range-restricted taxa than in widespread taxa
