Fig. 2.

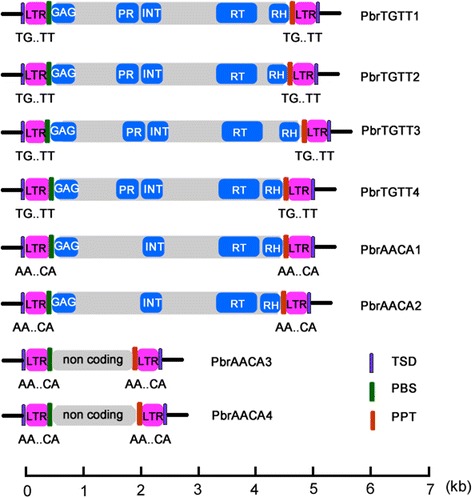
Schematic representation of TGTT and AACA structures in pear. The black lines at the ends represent the DNA sequences. The scale below measures the lengths of the elements

Schematic representation of TGTT and AACA structures in pear. The black lines at the ends represent the DNA sequences. The scale below measures the lengths of the elements