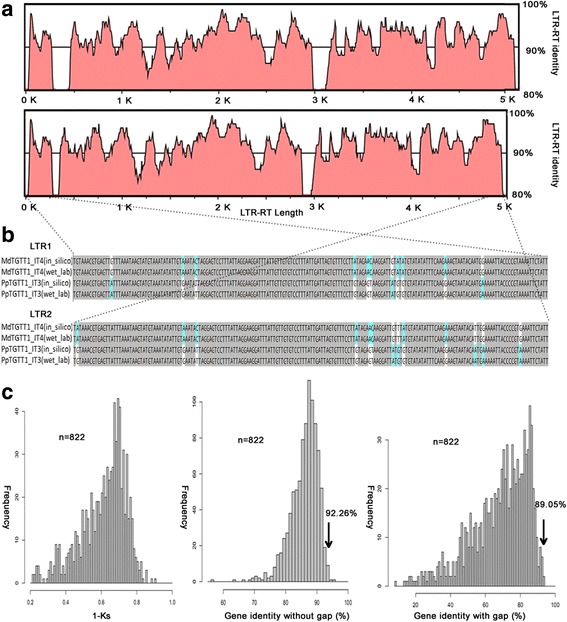
Fig. 6.

Comparisons between the sequence identities of HT LTR-RTs and the genomic distances between the two host species involved in the HT. a The sequence identities along the complete lengths of the HT LTR-RTs. The black line represents the 90% identity threshold. b Wet laboratory validation of the HTTs. Sequenced PCR products of LTRs were aligned with the sequences that were mined from the genome sequence. c Histogram representing the distribution of orthologous single-gene identities based on Ks analyses and CDS comparisons with or without gaps (see Methods). The numbers of CDS pairs of orthologous single genes analyzed are as indicated (n). Arrows correspond to average sequence identities between the HT LTR-RTs
