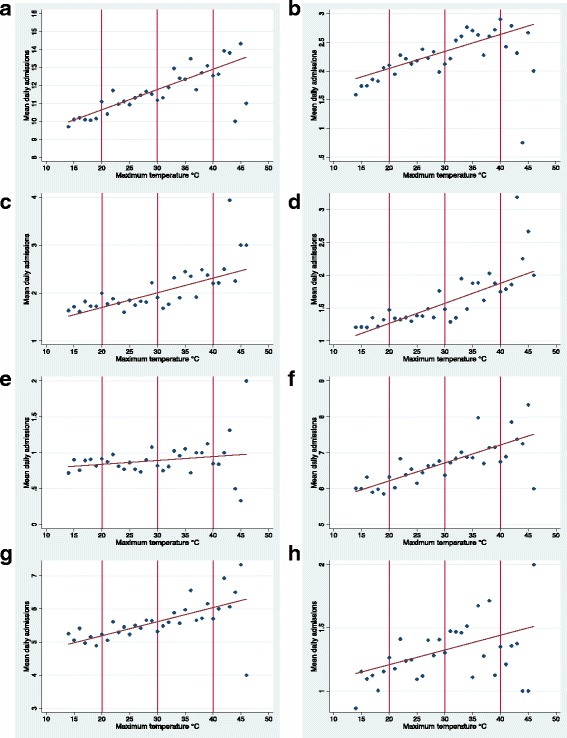
Fig. 3.

Daily maximum temperature and mean hospital inpatient renal admissions. Descriptive graphs for mean number of daily hospital inpatient admissions for renal disease in relation to daily maximum temperature rounded to the nearest 1°C during the warm season (October – March) in Adelaide from 1 July 2003 to 31 March 2014. Data points are separated by 1°. Graphs are in relation to (a); total renal disease (b); urolithiasis (c); renal failure (d); AKI (e); CKD (f); UTI (g); lower UTI (h); pyelonephritis
