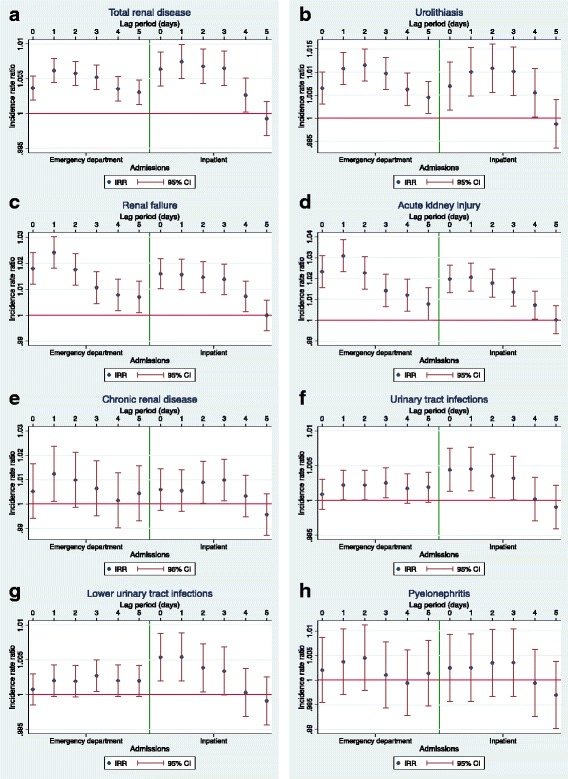
Fig. 6.

Incidence rate ratios (IRRs) for renal outcomes and daily maximum temperature for lag periods of 0–5 days. Graphs for incidence rate ratios (IRRs) for daily admissions for renal diseases and associated 95% confidence intervals (95% CI) in relation to daily maximum temperature per 1°C, during the warm season (October – March) in Adelaide from 1 July 2003 to 31 March 2014. Admissions are listed for each day over a lag period of 0 to 5 days. The left sides of the graphs represent emergency department admissions, and the right sides represent inpatient admissions. Graphs are in relation to (a); total renal disease (b); urolithiasis (c); renal failure (d); acute kidney injury (e); chronic kidney disease (f); urinary tract infections (g); lower urinary tract infections (h); pyelonephritis
