
Figure 2.
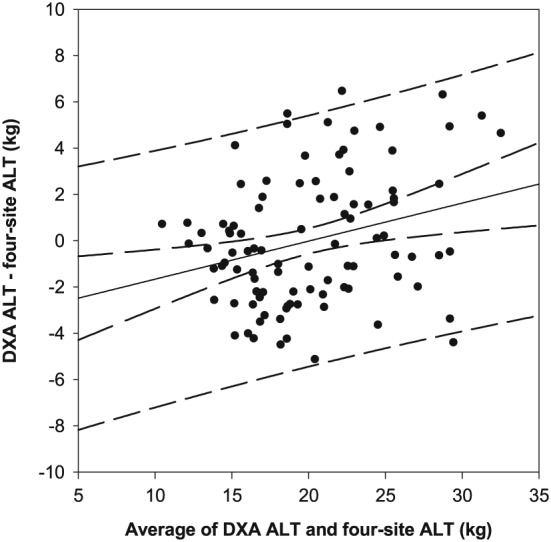
Bland–Altman plot comparing DXA derived and four‐site predicted appendicular lean tissue mass, utilizing participants from all folds. A significant (P < 0.05) proportional bias was present (solid black line, 95% CI—inner curved dashed lines), with 95% prediction intervals (outer curved dashed lines) with an average range on the highest (35 kg) and lowest (10 kg) ends of appendicular lean tissue of −5.67 and 5.67 kg. ALT, appendicular lean tissue mass; CI, confidence interval; DXA, dual‐energy X‐ray absorptiometry.