
Figure 3.
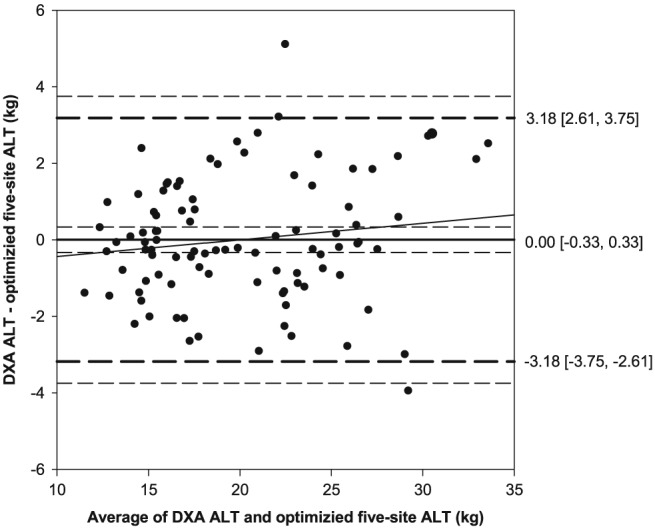
Bland–Altman plot comparing DXA‐derived and the optimized five‐site‐predicted appendicular lean tissue mass, utilizing participants from all folds. No fixed (0.00 [−0.33, 0.33]) or proportional bias was present (solid black line, 95% CI—inner short dashed line), with limits of agreement (1.96 SD) of −3.18 and 3.18 (middle long dashed lines) and tolerance limits of −3.75 and 3.75 (outer short dashed lines). ALT, appendicular lean tissue mass; CI, confidence interval; DXA, dual‐energy X‐ray absorptiometry; SD, standard deviation.