
Figure 4.
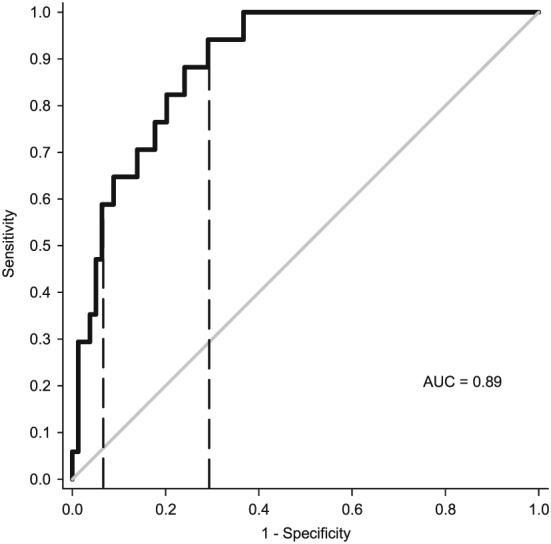
ROC curve averaged across three validation folds, utilizing the optimized five‐site protocol to identify lower than normal lean tissue mass identified by DXA. The dashed lines indicate cut‐points of −0.6039 and −2.071. AUC, area under the curve; DXA, dual‐energy X‐ray absorptiometry, ROC, receiver operating characteristic.