
Figure 5.
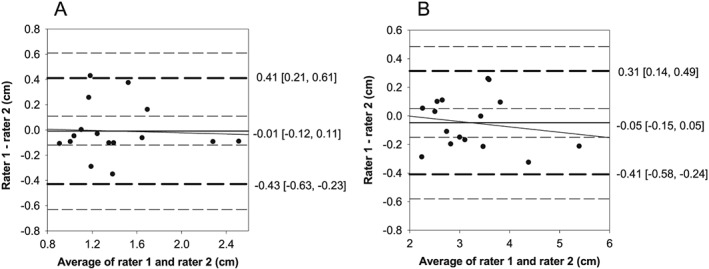
Bland–Altman plots for inter‐rater reliability using the four‐site protocol for (A) minimal and (B) maximal compression. (A) Minimal compression: no fixed (−0.05 [−0.15, 0.05]) or proportional bias was present (solid black line, 95% CI—inner long dashed lines), with limits of agreement (1.96 SD) of −0.41 and 0.31 (middle short dashed lines) and tolerance limits of −0.58 and 0.49 (outer long dashed lines). (B) Maximal compression: no fixed (−0.01 [−0.12, 0.11]) or proportional bias was present (solid black line, 95% CI—inner long dashed lines), with limits of agreement (1.96 SD) of −0.43 and 0.31 (middle short dashed lines) and tolerance limits of −0.63 and 0.61 (outer long dashed lines). CI, confidence interval; SD, standard deviation.