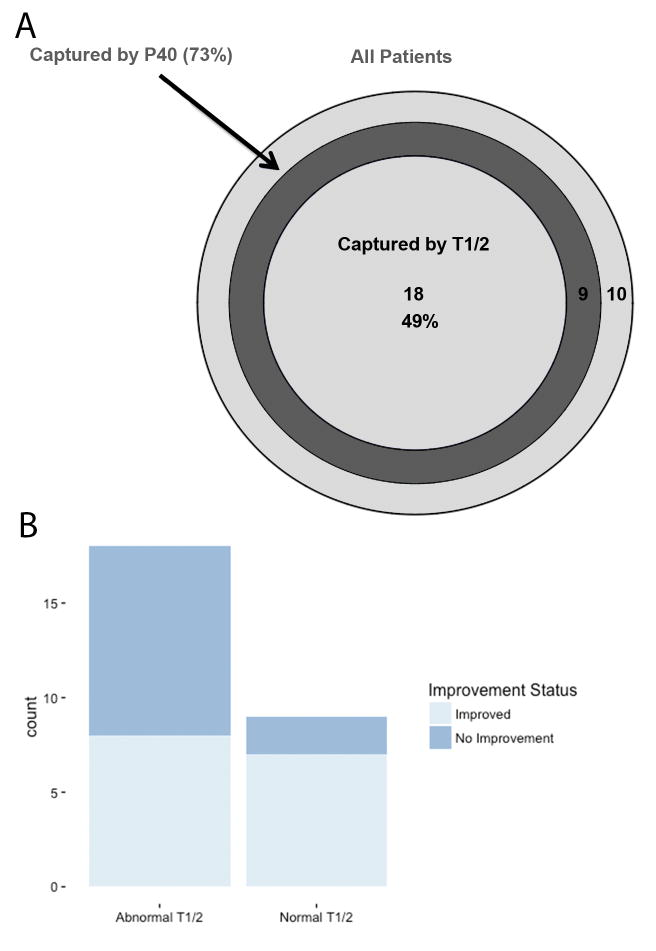
Figure 3.
(A) Euler diagram representing the patients that were identified as abnormal by T1/2 (innermost circle), patients that were abnormal by P40 (second circle, encompassing all abnormal T1/2 patients). The outer circle represents all patients included in the study, including those with normal P40 and T1/2 despite having clinically relevant UPJO. (B) The number of patients who had normalization of their P40 after surgery with a pre-operatively abnormal P40 and either a normal or abnormal T1/2.

