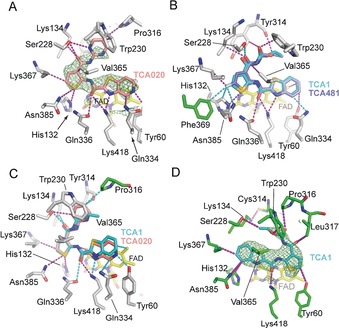
Figure 2.

Non‐covalent interactions of TCA inhibitors with DprE1. A) Inhibitor TCA020 (pink) with non‐covalent interactions indicated in dashed lines (magenta). The unbiased Fo−Fc density map (contoured at 2.5 σ) was calculated with model phases prior to incorporation of the ligand in the structural model. Protein residues are shown in gray sticks, FAD in yellow sticks. B, C) Superposition of TCA1 with the inhibitors TCA481 and TCA020, respectively. Dashed lines in cyan indicate new or shortened non‐covalent interactions compared to the TCA1:wt‐DprE1 complex (see Figure S1 for contact distances). Protein side chains in green indicate amino acids that—in TCA1:wt‐DprE1—fall outside the 4 Å contact radius. D) The flipped orientation of TCA1 (cyan) in the DprE1–Y314C active site.
