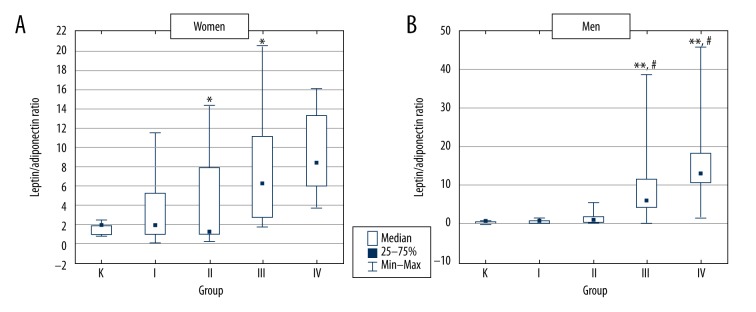
Figure 3.
Leptin/adiponectin ratio in control group and type 2 diabetic patients divided according to BMI value. K – control group, group I – type 2 diabetic patients with normal body weight, group II – type 2 diabetic patients with overweight, group III – type 2 diabetic patients with obesity and group IV – type 2 diabetic patients with severe obesity. * p<0.05 vs. group K; ** p<0.01 vs. group K; # p<0.05 vs. group I.

