. 2015 Apr 27;6(6):3593–3598. doi: 10.1039/c5sc00215j

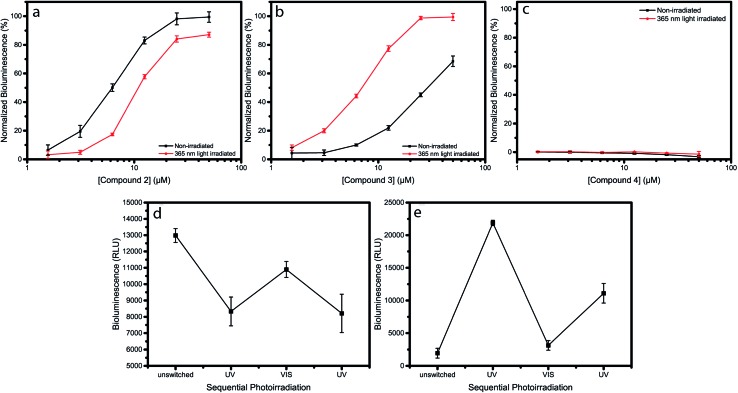
Fig. 2. Dose–response curves of compounds 2, 3 and 4, before and after irradiation, obtained by measuring the LasQS controlled bioluminescence at different concentrations, using the E. coli JM109 pSB1075 sensor strain. Dose–response curve of non-irradiated (black) and λ = 365 nm light-irradiated (red) compounds 2 (a), 3 (b) and 4 (c). (d) and (e) Effect of photoswitching on the biological activity of compounds 2 (d) and 3 (e). Both compounds were used at a concentration of 6.25 μM for the sequential rounds of photoirradiation. Data points and error bars represent the mean and pooled standard deviation of two biological replicates each performed in triplicate.

Fig. 2