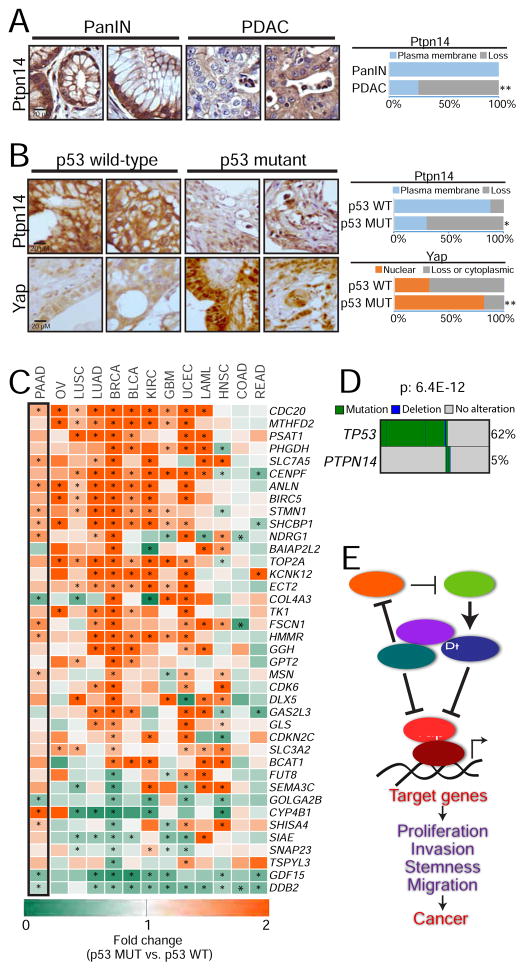
Figure 7. The p53-Ptpn14-Yap tumor suppressive axis is important in human cancers.
(A) (Left) Representative images of Ptpn14 immunohistochemistry on PanIN (n=53) and PDAC (n=109) samples. (Right) Percentage of samples with Ptpn14 plasma membrane staining. (B) (Left) Representative images of Ptpn14 and Yap immunohistochemistry in PDAC samples with known p53 status (n=32 and n=64, for TP53 wild-type and mutant respectively; defined by sequencing of the TP53 gene). (Right) Percentage of samples with Ptpn14 plasma membrane staining and with Yap nuclear localization. (C) Heat map showing the fold-change in the expression of Yap-activated genes in tumor samples harboring TP53 mutations relative to tumors with wild-type p53. Only genes where p value for summary statistics across different tumors was ≤ 9.8E-17 are shown. Asterisks denote significant changes (p ≤ 0.05) within each gene/tumor type, based on a linear regression model. The black box highlights the results obtained in pancreatic cancer (PAAD). Ovarian cancer (OV), lung squamous cell carcinoma (LUSC), lung adenocarcinoma (LUAD), breast cancer (BRCA), bladder cancer (BLCA), kidney cancer (KIRC), glioblastoma (GMB), uterine cancer (UCEC), acute leukemia (LAML), head and neck carcinoma (HNSC), colon (COAD) and rectal adenocarcinomas (READ). (D) Map depicting TP53 and PTPN14 mutations in gastrointestinal cancers. Mutual exclusivity was evaluated using the DISCOVER algorithm. (E) Proposed model incorporating Ptpn14 and Yap into the p53 tumor suppression program. For the TMA analysis, * p ≤ 0.05; ** p ≤ 0.001, Fisher test. For the heat map of the fold-change, * p ≤ 0.05, based on a linear model built for each Yap target gene.

