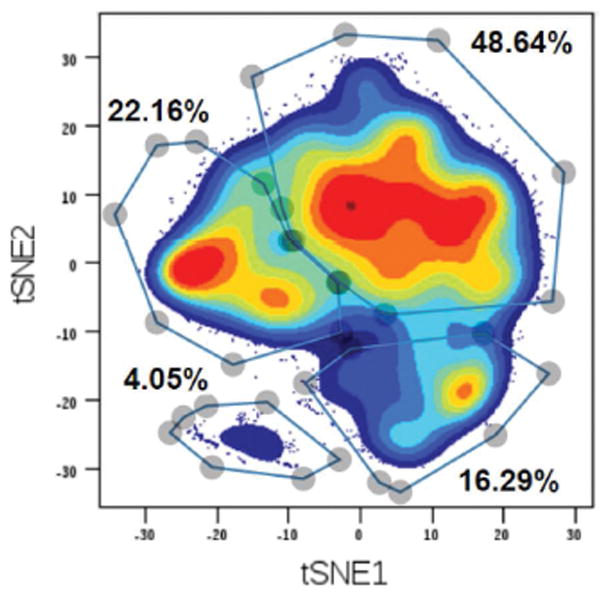
Figure 1.

Mass cytometry defines four human beta-cells states or subtypes. Single cell suspensions were prepared from human islets and subjected to mass cytometry (CyTOF) with 24 heavy isotope-labeled antibodies. After gating for only C-peptide positive beta-cells, beta cells were next analyzed by the t-distributed stochastic neighbor embedding (t-SNE) algorithm for dimensionality reduction to visualized beta-cell subtypes. Colors indicate density of the cells, and subgroups were manually gated based on natural occurring groups. From Wang et al., 2016. Cell Metabolism (Reference 12), with permission.
