
Figure 3.
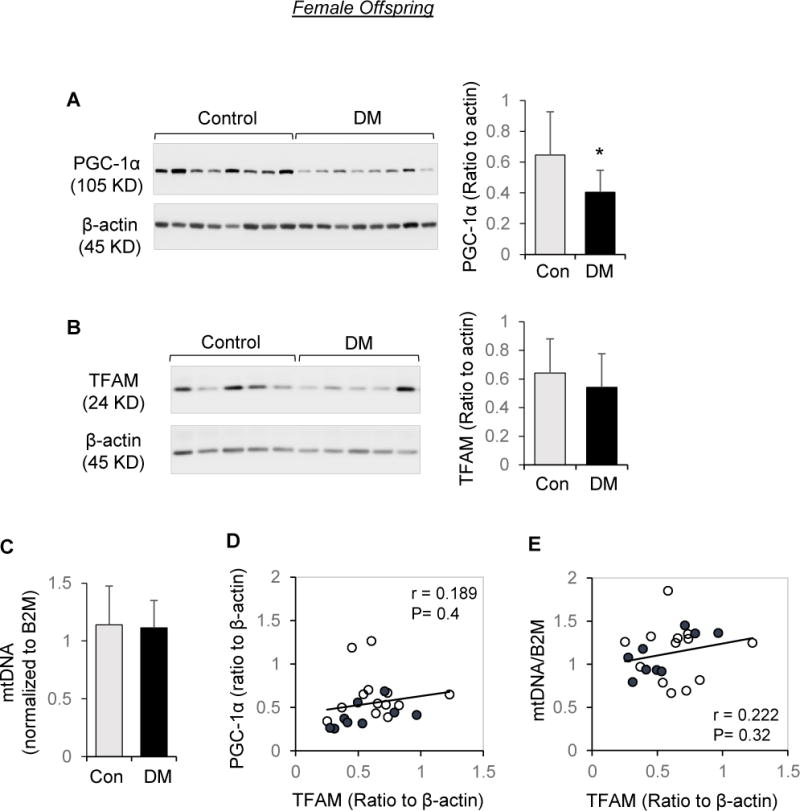
Effects of maternal diabetes on PGC-1α/TFAM/Mitochondrial DNA abundance in placentae of female offspring. Protein extracts subjected to Western blot analysis and DNA extracts were analyzed by quantitative RT-PCR. A, B, and C: Representative Western blots and quantitation of PGC-1α (A) and TFAM (B), and fold change of mitochondrial tRNALeu(UUR) gene DNA copy number normalized to β2-microglobin (C) in female placentae of diabetic pregnancies (DM, n=9) and non-diabetic controls (n=13). Bar graphs are presented as mean ± SD, * P<0.05. D: Correlation between PGC-1α and TFAM protein levels. E: Correlation between mtDNA copy number to TFAM protein levels. Open circle: control group; Solid circle: DM.