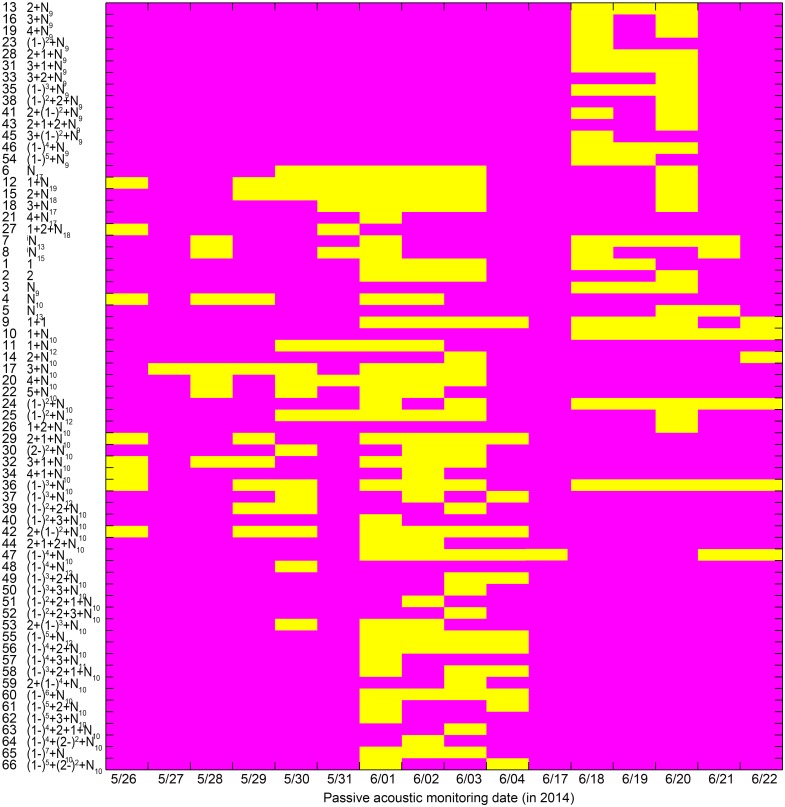
Figure 10. Occurrence pattern of the 66 call types during passive acoustic monitoring periods.
Yellow patches in the matrix indicate the corresponding call types (x-axis) observed on that day (y-axis). Call types are clustered according to their median IPPI and the number on the y-axis corresponds to the call type sequence in Table 1.

