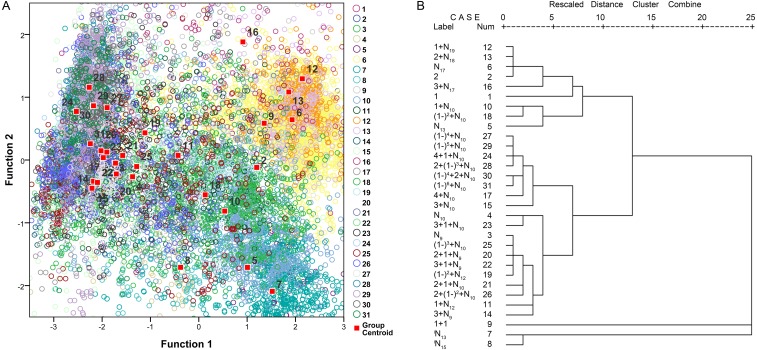
Figure 9. Scatterplot using the canonical discriminant function (A) and dendrogram using the hierarchical clustering method (B) of 31 extracted call types.
The “Rescaled distance cluster combine” axis in B shows the distance at which the clusters combine. When creating a dendrogram, SPSS rescales the actual distance between the cases to fall into a 0–25 unit range; thus, the last merging step to a one-cluster solution occurs at a distance of 25.

