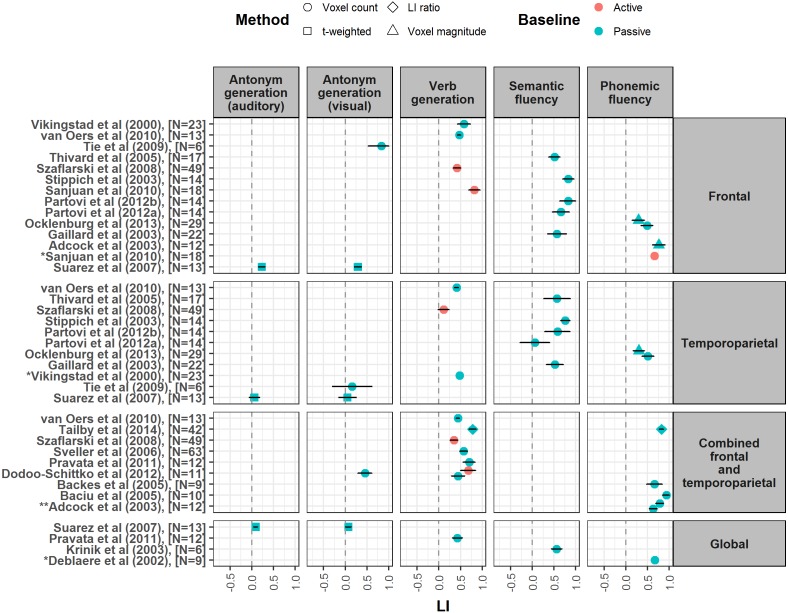
Figure 2. Forest plot shows mean LI values for verbal fluency tasks reported from studies meeting our criteria.
Plot is divided up according to region of interest used for LI calculation (frontal, temporoparietal, combined frontal and temporoparietal and global). Error bars represent 95% confidence limits. Colour of symbol indicates type of baseline task used (active or passive), and shape of symbol indicates method of LI calculation (see key). *Papers did not report a measure of spread for LI values, so confidence interval is not shown. ** LI values reported by this paper are given at different thresholds: Z = 5.3 (Top), Z = 2.3 (Bottom). Figures 2–4 are published on Figshare and can be found at: https://figshare.com/articles/Forrest_Plots_of_LI_values_for_different_language_tasks/4977950.

