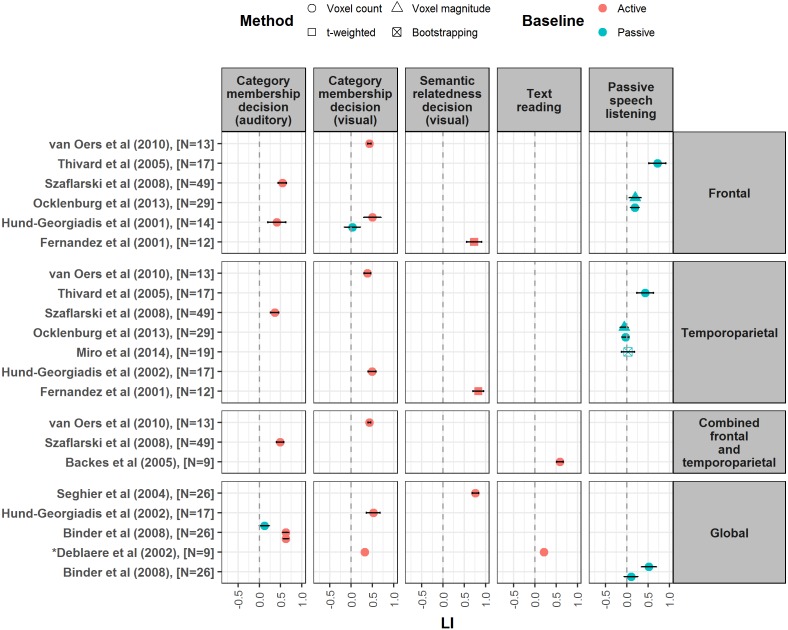
Figure 4. Forest plot of mean LI values for semantic decision, text reading and speech listening tasks.
Forest plot shows mean LI values for different language tasks reported from studies meeting our criteria. Plot is divided up according to region of interest used for LI calculation (frontal, temporoparietal, combined frontal and temporoparietal and global). Error bars represent 95% confidence limits. Colour of symbol indicates type of baseline task used (active or passive), and shape of symbol indicates method of LI calculation (see key). ∗Papers did not report a measure of spread for LI values, so confidence interval is not shown.

