Figure 6.
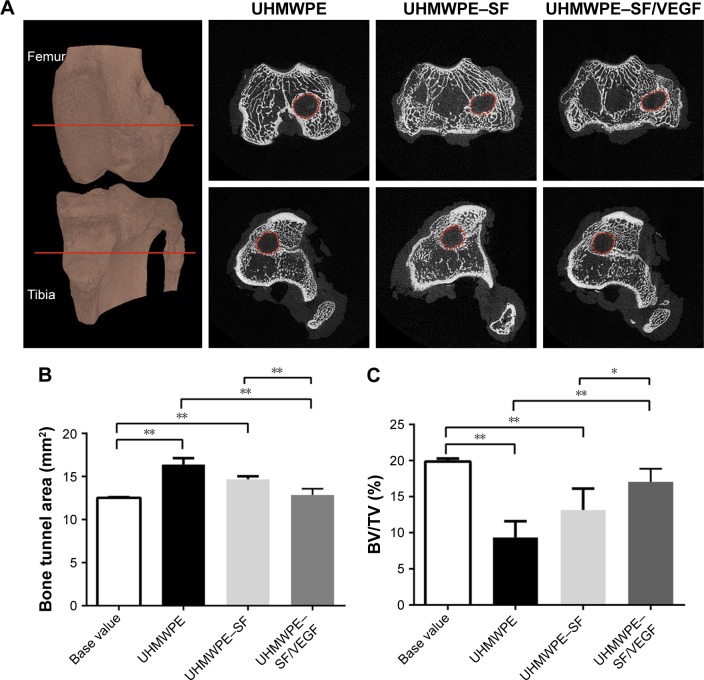
Micro-CT analysis of at the UHMWPE group, the UHMWPE–SF group, and the UHMWPE–SF/VEGF group at the time of 12 weeks after surgery.
Notes: (A) Micro-CT scans of specimens from three groups at the time of 12 weeks after surgery. The cross-sectional areas of the bone tunnels at the depth of 5 mm from the femur joint surface and tibial joint surface were measured. Representative axial micro-CT images: the upper and lower panels show images obtained from femur and tibia, respectively. Areas within the red dotted circles represent the cross-sectional areas that were measured for each bone tunnel. (B) Quantification of cross-sectional areas of the bone tunnels. (C) The trabecular bone volume fraction of the total tissue volume of interest (BV/TV) value. *P<0.05; **P<0.01.
Abbreviations: micro-CT, microcomputed tomography; SF, silk fibroin; UHMWPE, ultra-high-molecular-weight polyethylene; VEGF, vascular endothelial growth factor.

