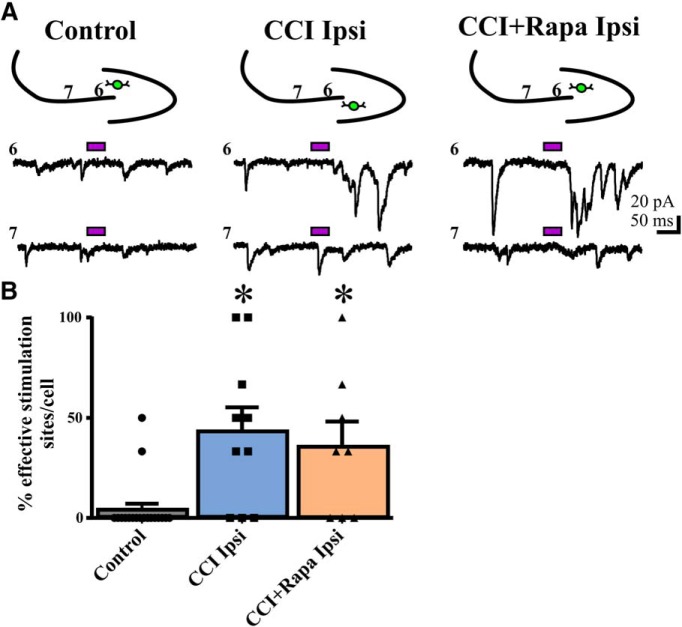
Figure 4.
Rapamycin fails to suppress the injury-induced increase in eEPSC responses from CA3 pyramidal cells to eGFP+ hilar interneurons 8–12 weeks after injury. A, Representative traces showing responses in eGFP+ hilar interneurons to glutamate photostimulation applied to CA3 pyramids from three different treatment groups: control, CCI Ipsi, and CCI + Rapa Ipsi. Bars above traces indicate glutamate photostimulation period. The relative position of the recorded hilar interneuron (green) and numbered stimulation sites in the CA3 pyramidal cell layer are shown on the stereotyped drawing above each set of traces. B, Individual and mean percentage of effective stimulation sites in control, CCI Ipsi, and CCI + Rapa Ipsi groups. Error bars indicate SEM; *p < 0.05 compared to control. The number of stimulation sites, cells, and animals from separate treatment groups are presented in Table 3.

