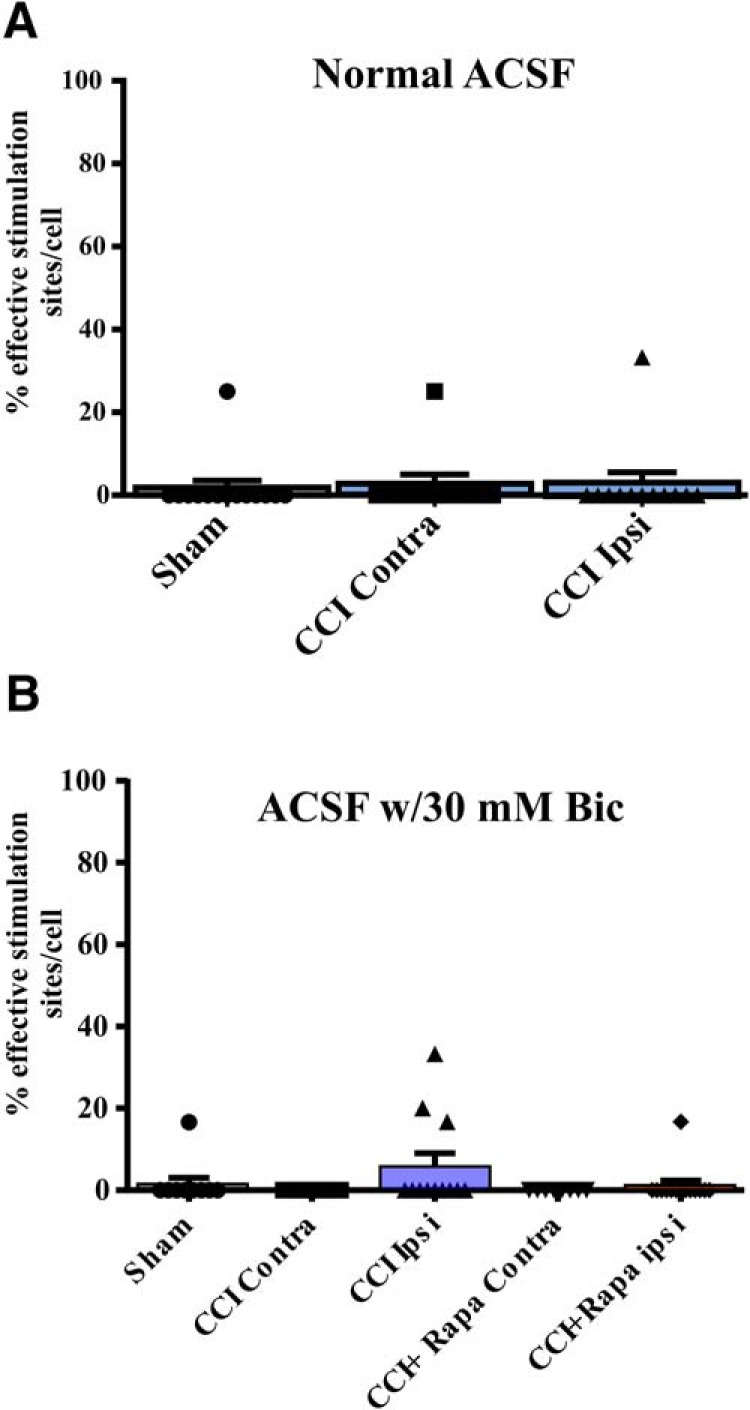
Figure 5.

eEPSC responses in DGCs after glutamate photostimulation of CA3 pyramidal cells 8–12 weeks after injury. A, Individual and mean percentage of effective stimulation sites. Responses in DGCs from three different treatment groups: sham, CCI Contra, and CCI Ipsi in normal ACSF. B, Individual and mean percentage of effective stimulation sites for DGCs in the presence of 30 μM bicuculline from three different treatment groups: control (i.e., sham and contralateral hemispheres), CCI Contra and Ipsi, and CCI + Rapa Contra and Ipsi. The number of stimulation sites, cells, and animals from separate treatment groups are presented in Tables 4, 5.
