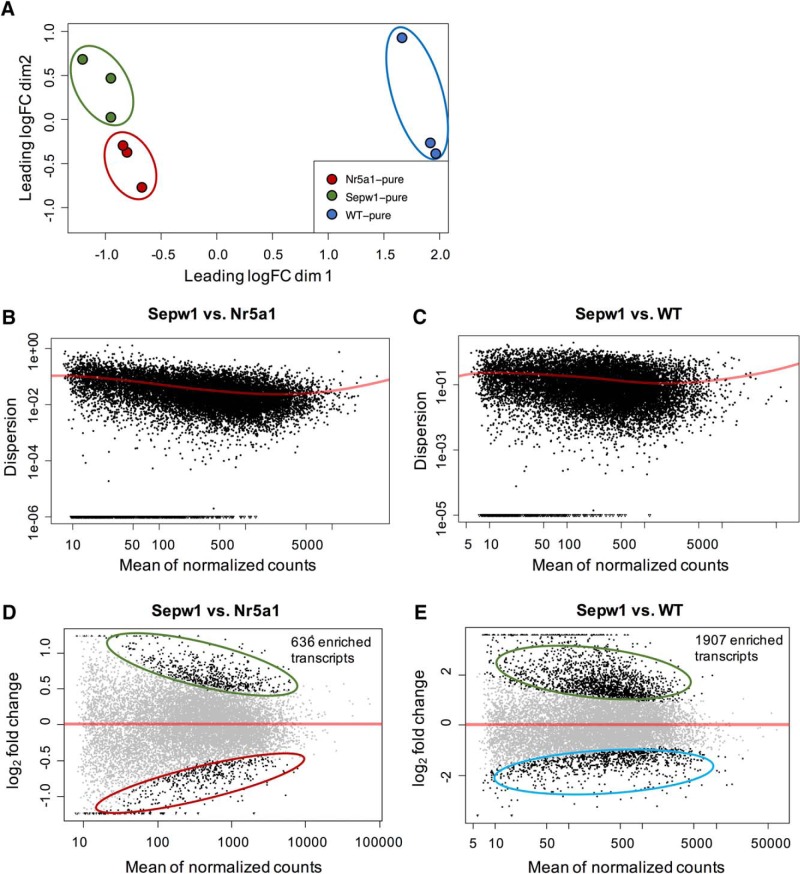
Figure 2.
NMDS clustering of sample types and differential expression analysis. A, Multiple dimensional scaling plot showing clustering of samples with the first dimension representing leading fold change distances (root mean square of the 500 largest fold changes between pairs of samples; Chen et al., 2014; Huber et al., 2015; Law et al., 2016) between Sepw1-pure, Nr5a1-pure, and WT-pure RNA sample types (filtered and normalized gene counts). B, C, DESeq-generated graphs showing the estimated dispersion values and fitted curves produced using filtered count data (Anders and Huber, 2012) for the Sepw1-pure to Nr5a1-pure (B) or Sepw1-pure to WT-pure (C) comparisons. D, E, Differentially expressed genes after DESeq analysis of Sepw1-pure samples compared to either Nr5a1-pure (D) or WT-pure sample types (E).

