Figure 3.
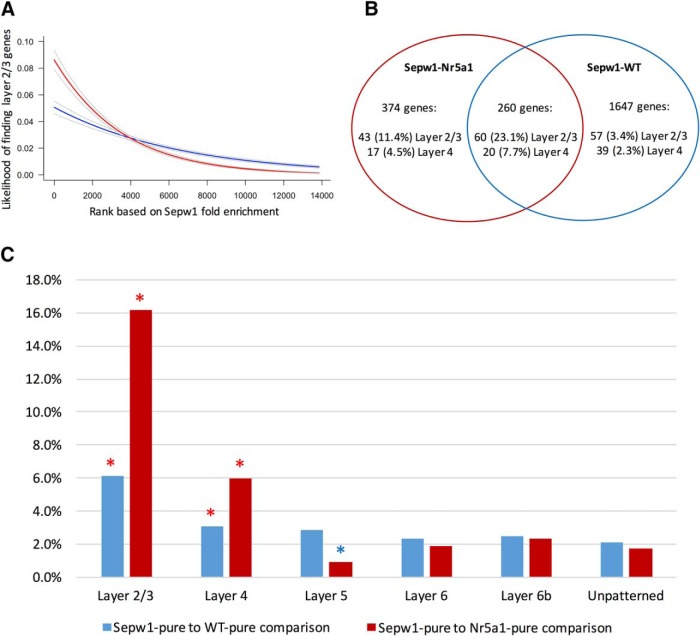
Differences in composition of Sepw1-enriched genes identified using Sepw1-Nr5a1 or Sepw1-WT comparisons. A, Logistic regression analysis shows the likelihood of finding layer 2/3-enriched genes (Belgard et al., 2011) as a function of the fold change in transcript expression associated with Sepw1-enrichment. Fold changes were used to rank genes based on the level of Sepw1-enrichment, with the highest Sepw1-fold enrichment given a rank of 1 and decreasing fold enrichments given progressively higher ranks. Using both Nr5a1 (red) and WT (blue) comparisons, the likelihood of finding layer 2/3 genes is significantly greater with higher Sepw1 fold enrichment (logistic regression, p < 2e-16 for both WT and Nr5a1 comparisons). B, Venn diagram showing the number and proportion of genes that are upper layer enriched when Sepw1-pure samples are compared to WT-pure or Nr5a1-pure samples. C, Genes found in layer 2/3 are highly represented among Sepw1-enriched genes. The percentage of Sepw1-enriched genes found using Nr5a1-pure or WT-pure comparisons that overlap with database layer enriched genes, is shown. Numbers of overlapping genes falling outside the upper (red) or lower (blue) 95% confidence limits of the mean (derived from resampled distributions indicated in Table 1-1) are marked with an asterisk.

