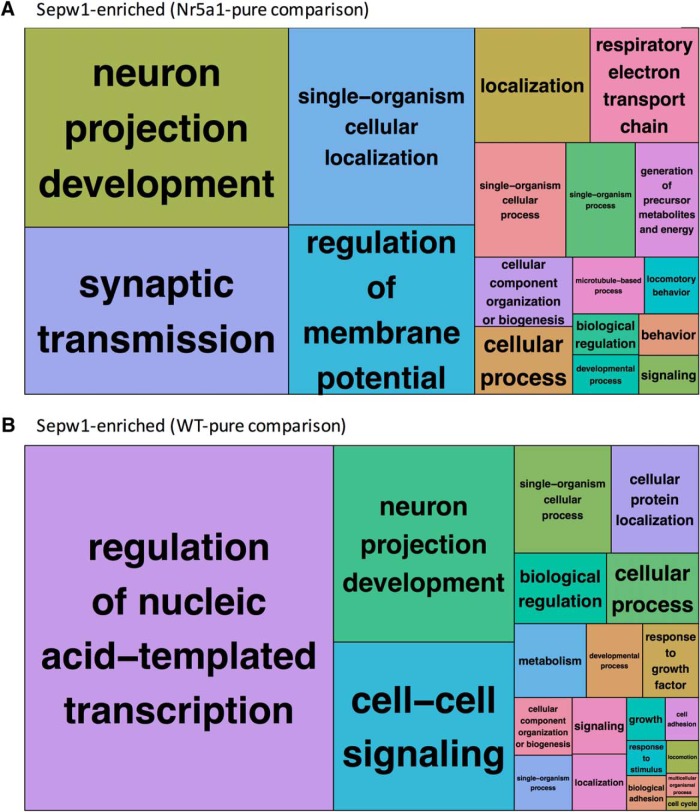
Figure 4.
REVIGO GO tree-maps showing differences in Sepw1-enriched gene classifications using WT-pure or Nr5a1-pure comparisons. A, REVIGO tree-map showing GO clusters formed using Sepw1-enriched transcripts when Nr5a1-pure is used as a comparison; p values and GO classifications used to create this tree map are shown in Figure 4-1. B, REVIGO tree-map showing GO clusters formed using Sepw1-enriched transcripts when WT-pure is used as a comparison; p values and gene-ontology classifications used to create this tree map are shown in Figure 4-2.

