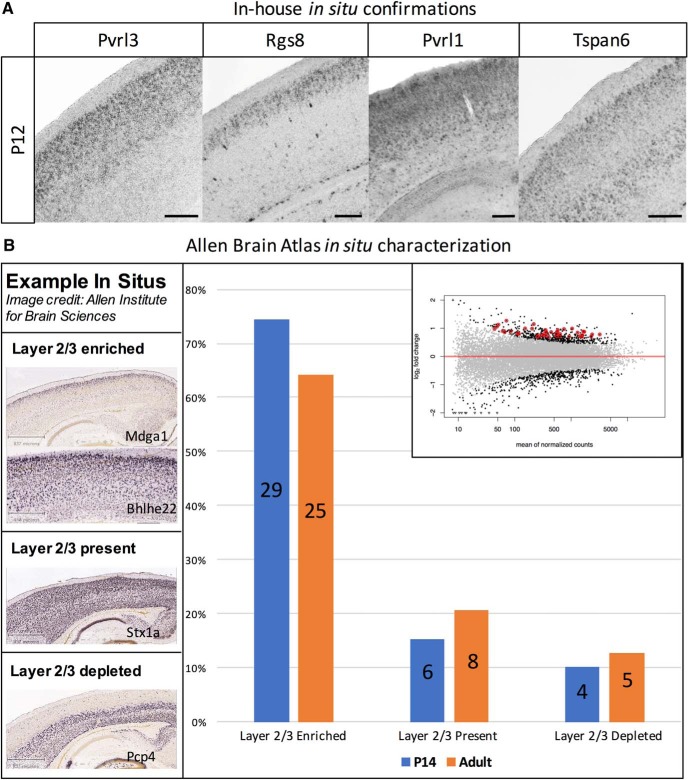
Figure 5.
In situ confirmations of Sepw1-enriched genes. A, In house in situ hybridizations to four genes of interest, Pvrl3, Rgs8, Pvrl1, and Tspan6, demonstrated upper layer specific or enriched expression at P12 (scale bar: 200 μm). In situs to three additional genes showed expression throughout cortex (Fig. 5-1). B, Approximately 70% of select Sepw1-enriched genes show layer 2/3 enrichment, confirmed using in situ data. The percentage of Sepw1-enriched genes (Sepw1-pure to Nr5a1-pure comparison) found in various expression categories, based on Allen Brain Atlas in situ data, is shown. Of the top 300 genes found to be Sepw1-enriched, 44 had existing in situ data at P14 found at allenbrain.org (Developing Mouse Brain; Allen Institute for Brain Science, 2008). These in situs were classified manually as: layer 2/3 enriched, layer 2/3 present (no enrichment), or layer 2/3 depleted (examples found in left panel). Unclear database in situs were excluded from this analysis. Most genes were found to be either enriched or present in cortical layer 2/3 neurons. While the expression patterns of a few of these genes changed from P14 (blue) to adult (orange), most showed similar expression patterns over development (Mouse Brain; Allen Institute for Brain Science, 2004). Genes included in the analysis are circled in the DESeq differential expression plot in red (upper right), and highlighted red in Extended Table 1-3.

