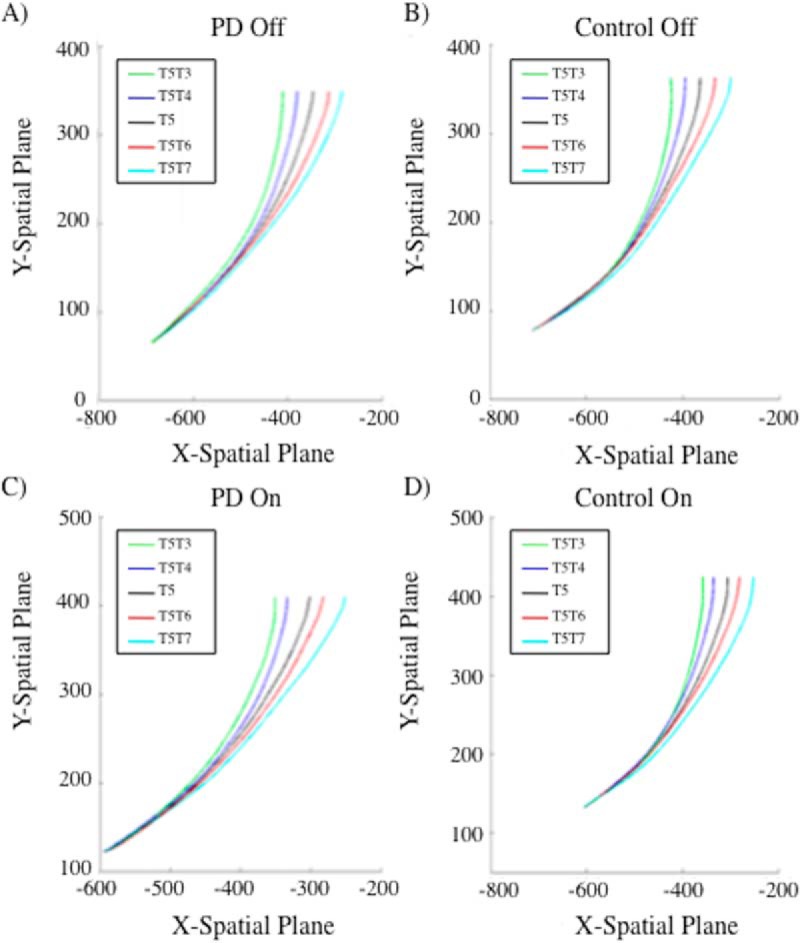
Figure 7.

Mean trajectory plots for reaches originally directed to T5 for (A) PD patients off dopaminergic medication, (B) controls off dopaminergic medication, (C) PD patients on dopaminergic medication, and (D) controls on dopaminergic medication. Black line represents the baseline reach to stationary T5. PD patients do not significantly differ from controls at the point of divergence for any of the reach comparisons both on and off of dopaminergic therapy.
