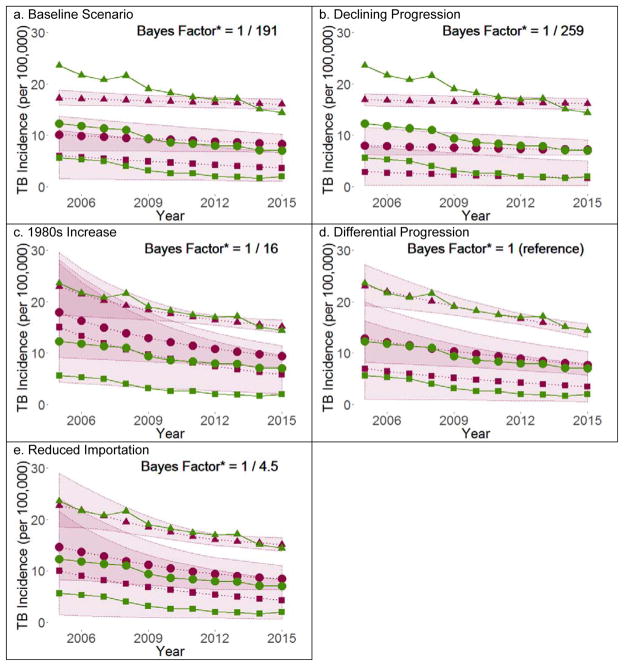
Figure 1.
Estimated versus Actual TB Incidence in US-born, Foreign-born, and Total NYC Population under Five Scenarios
Mean model estimates (points) of TB incidence with 95% credible intervals (ribbon) shown in purple, case notification rates (points) shown in green. Triangles denote the foreign-born, squares denote the US-born, and circles denote the total population. *Bayes Factors are with respect the Differential Progression scenario. A Bayes factor is the ratio of the overall likelihood of one scenario versus another – the greater the ratio, the more the data (TB incidence in 2010 and 2015) support one scenario over the other. A Bayes factor of 1/10 or less indicates strong evidence in favor of the Differential Progression scenario.18

