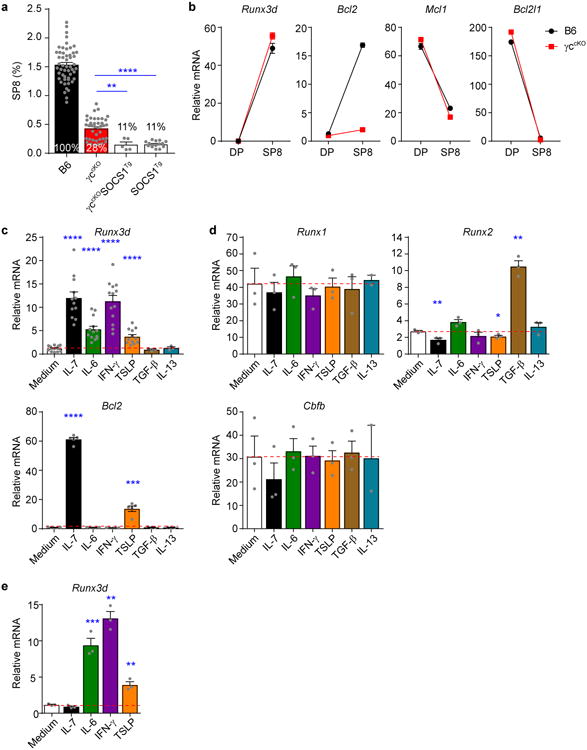
Figure 1. Runx3d induction by non-γc cytokine signals.

(a) CD8 T cell generation in the thymus by non-γc cytokine signals. Frequencies of TCRβhiCD8SP (SP8) thymocytes in the indicated mouse strains are displayed as a bar graph and numbers within the bars display SP8 frequencies relative to that in normal B6 mice (set equal to 100%). In γccKO mice SP8 cells that had failed to delete γc were excluded from the analysis. Data are from 5-52 mice combined from 3-44 experiments. (b) Expression of mRNA encoding the indicated genes in pre-selection DP (CD69-CD4+CD8+) and SP8 thymocytes was determined by quantitative PCR and normalized to Rpl13a. Data are technical triplicates representative of two experiments. (c,d) B6 pre-selection DP thymocytes were stimulated with various cytokines during the DP stimulation assay (schematized in Supplementary Fig. 1e) and their subsequent expression of Runx3d and Bcl2 mRNA displayed in c, and their subsequent expression of Runx1, Runx2 and Cbfb mRNA displayed in d, and compared to medium alone (horizontal red dashed line). Data are combined from 3-13 experiments in c and 2-3 experiments in d. (e) γccKO pre-selection DP thymocytes were stimulated with the indicated cytokines during the DP stimulation assay and their subsequent expression of Runx3d mRNA determined. Data are technical triplicates representative of two experiments. Mean and s.e.m. are shown. *P < 0.05, ** P < 0.01, ***P < 0.001, ****P < 0.0001.
