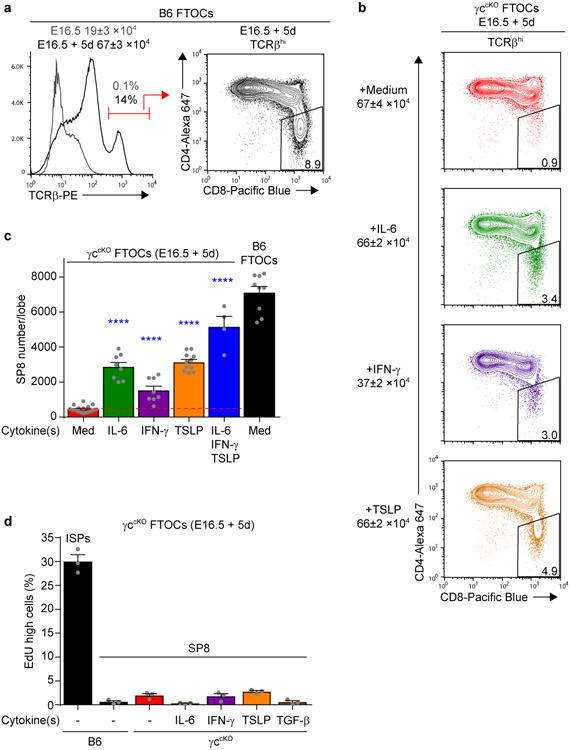
Figure 2. Non-γc cytokines generate SP8 cells in FTOCs.

(a) Thymocyte profiles of E16.5 thymic lobes from B6 mice on d0 (gray line) and d5 (black line) of culture. Cell numbers/lobe before and after 5d culture are shown above the TCRβ histogram (left). A profile of TCRβhi thymocytes after 5 days of culture is shown on the right. Data are from 3-9 individual lobes combined from 2-4 experiments. (b) Profiles of TCRβhi thymocytes from γccKO FTOCs after 5 days in culture with the indicated cytokines are displayed. Numbers of total cells/lobe are indicated on the left and SP8 cell frequencies among TCRβhi thymocytes are displayed in boxes within the profiles. Data are from 8-11 individual lobes combined from 3 experiments. (c) Bar graph of SP8 cell numbers from γccKO FTOCs cultured with the indicated cytokines, with SP8 cell numbers in each cytokine group compared to medium alone (horizontal red dashed line). As an additional comparison, SP8 cell numbers from B6 FTOCs are also shown. Data are from 4-17 individual lobes combined from 2-6 experiments. (d) Frequencies of EdUhi cells among SP8 cells from B6 and γccKO FTOCs cultured with the indicated cytokines. EdU was added during the last 14h of culture. ISP (CD4-CD8+TCRβ-) thymocytes from B6 FTOCs are shown as a positive control for EdU incorporation. Data are from 3 individual lobes combined from 2 experiments. Mean and s.e.m. are shown. ****P < 0.0001.
