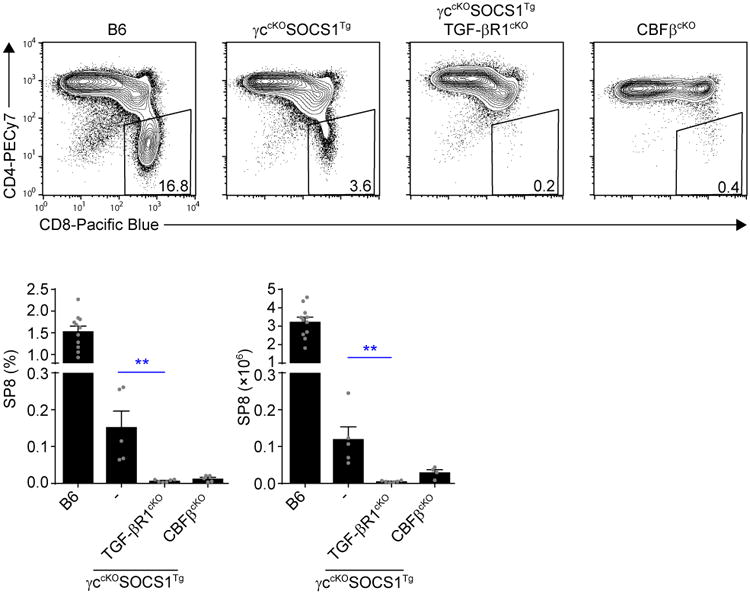
Figure 6. Elimination of in vivo signaling by all lineage-specifying cytokines.

Profiles of TCRβhi thymocytes from the indicated mice are shown, and numbers in boxes within the profiles indicate frequency of SP8 cells among TCRβhi thymocytes (top). Bar graphs display SP8 thymocyte frequencies (bottom left) and numbers (bottom right) from the indicated mice. Data are from 4-11 mice combined from 2-5 experiments. Mean and s.e.m. are shown. **P < 0.01.
