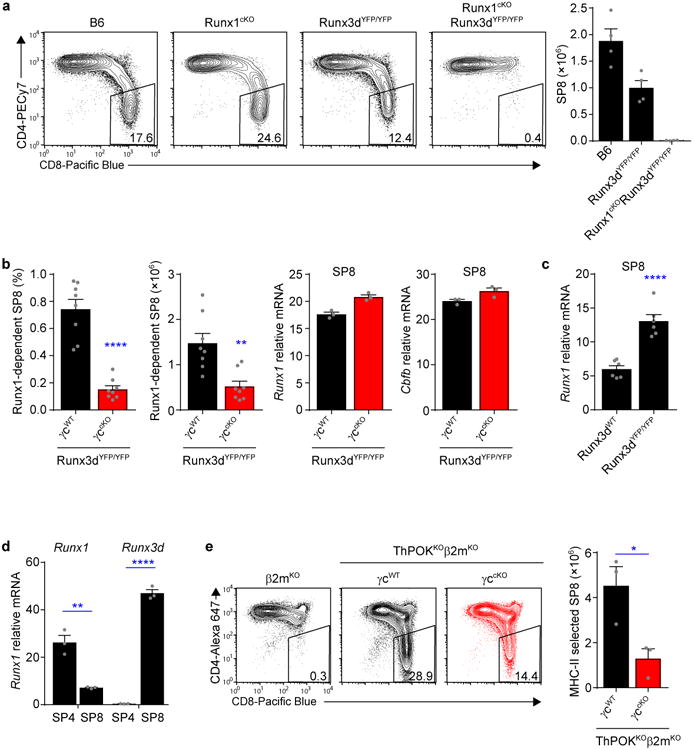
Figure 7. In vivo cytokine signaling is always required for SP8 cell generation.

(a) Profiles of TCRβhiCCR7+ thymocytes from the indicated mice are shown, and numbers in boxes within the profiles indicate frequency of SP8 cells among TCRβhi thymocytes (left). Bar graph displays SP8 thymocyte numbers in each mouse strain (right). Data are from 2-5 mice combined from 2-5 experiments. (b) Comparisons of SP8 thymocyte frequencies (left) and numbers (middle) in γc-sufficient (γcWT) and γc-deficient (γccKO) Runx3dYFP/YFP mice, and Runx1 and Cbfb mRNA abundance in SP8 cells from the same mice (right). Cell numbers and frequencies are from 8 mice combined from 5 experiments, quantitative PCR data are technical triplicates and one of two experiments is shown. (c) Comparison of Runx1 mRNA expression in electronically sorted SP8 thymocytes from Runx3d-sufficient (Runx3dWT) and Runx3d-deficient (Runx3dYFP/YFP) mice. Data are replicates from two representative experiments out of a total of four experiments done. (d) Runx1 and Runx3d mRNA expression in electronically sorted SP4 and SP8 thymocytes from B6 mice. Data are technical triplicates and one of two experiments is shown. (e) Profiles of MHC class II-selected TCRβhi thymocytes from γc-sufficient (γcWT) and γc-deficient (γccKO) ThPOKKOβ2mKO mice are shown, and numbers in boxes within the profiles indicate frequency of SP8 cells among TCRβhi thymocytes (left). The bar graph compares the number of MHC class II-selected SP8 thymocytes in γc-sufficient and γc-deficient ThPOKKOβ2mKO mice (right). Data are from 3 mice combined from 3 experiments. Mean and s.e.m. are shown. *P < 0.05, **P < 0.01, ****P < 0.0001.
