
Extended Data Figure 1. O-PDX models retain the cellular features of the corresponding patient tumors.
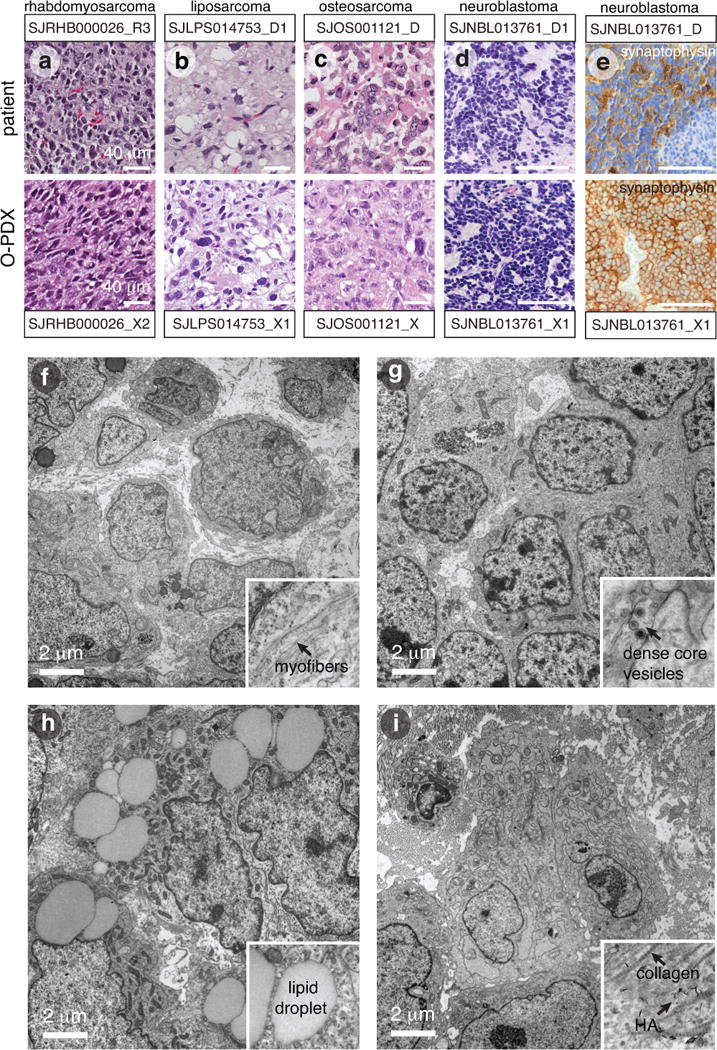
(a–d) Micrographs of hematoxylin and eosin–stained patient tumors and corresponding O-PDX tumors for a representative rhabdomyosarcoma (a), liposarcoma (b), osteosarcoma (c), and neuroblastoma (d). (e) Immunohistochemical staining for synaptophysin (brown) for SJNBL013761_D and the matched O-PDX. (f–i) Transmission electron micrographs of a representative rhabdomyosarcoma (f), neuroblastoma (g), liposarcoma (h), and osteosarcoma (i). Inset for each micrograph is a higher magnification view of a key cellular hallmark of each tumor. Abbreviations: HA, hydroxyapatite. Scale bars a–e, 40 μm; f–i, 2 μm.