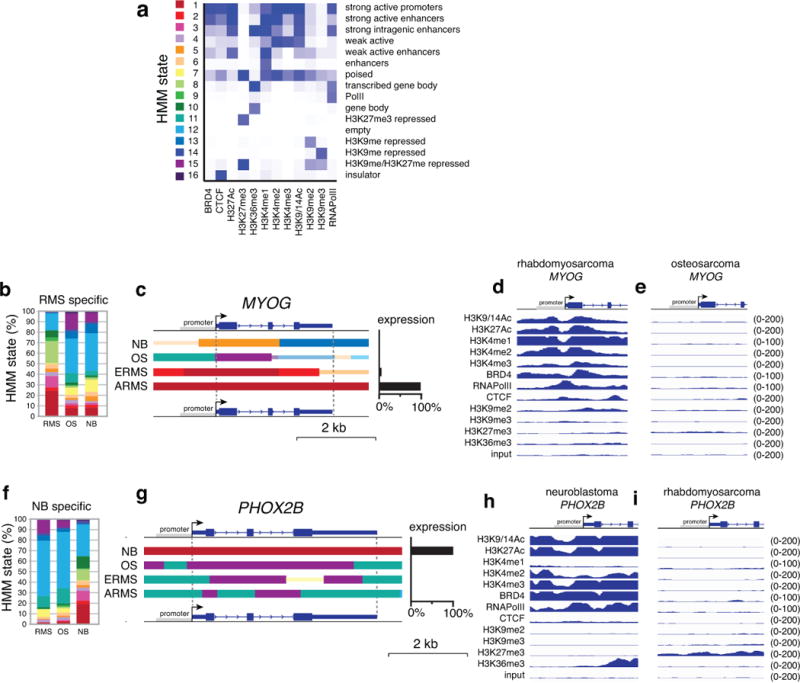
Extended Data Figure 4. Epigenetic landscape reflects cellular origins.

(a) Heatmap of the HMM states used in this study. (b) Stack histogram of the percentage of each of the 16 HMM states for the genes expressed specifically in rhabdomyosarcoma across the 3 tumor types (OS, NB, RMS). (c) Representative HMM and expression of a gene (MYOG) that is specifically expressed in rhabdomyosarcoma. (d,e) Corresponding ChIP-seq peaks for all 12 antibodies and the input sample for the MYOG promoter in the rhabdomyosarcoma and osteosarcoma O-PDXs. (O) Stack histogram of the percentage of each of the 16 HMM states for the genes expressed specifically in neuroblastoma across the 3 tumor types (OS, NB, RMS). (f) Representative HMM and expression of a gene (PHOX2B) that is specifically expressed in neuroblastoma. (g,h) Corresponding ChIP-seq peaks for all 12 antibodies and the input sample for the PHOX2B promoter in the neuroblastoma and rhabdomyosarcoma O-PDXs. Abbreviations: HMM, Hidden Markov Modeling; NB, neuroblastoma; OS, osteosarcoma; RMS, rhabdomyosarcoma.
