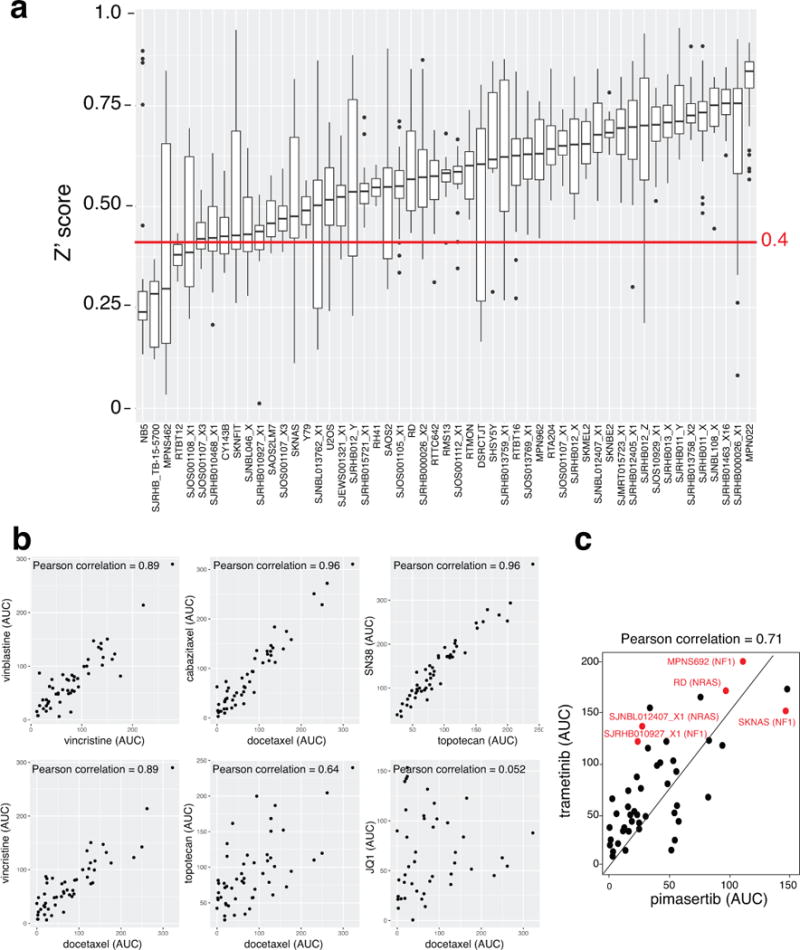
Extended Data Figure 5. Drug screening quality control.

a) Box plot for the Z-prime score for each of the 1,911 plates screened in this study that passed our quality control metrics. Most cell models (O-PDXs and cell lines) had a z-prime score above 0.4 (red line). The average z-prime was 0.57 and 95% of plates had z-prime between 0.27 and 0.82. b) Scatterplot of area under the curve (AUC) for the dose response curves for pairs of drugs with similar and dissimilar mechanisms. Larger AUC values represent greater drug potency (killing). The Pearson correlation is shown for each drug pair. c) Scatterplot of AUC for the dose response curve for two MEK inhibitors (trametinib and selumetinib). The cell models highlighted in red have mutations in the RAS/NF1/MEK pathway.
