
Figure 3. O-PDX tumors retain epigenetic and molecular signatures of their diverse cellular origins.
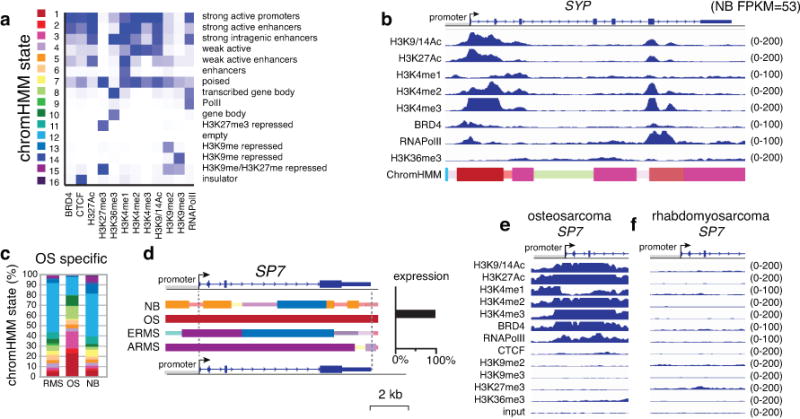
(a) Heatmap of the chromHMM states used in this study. (b) ChIP-seq data from the neuroblastoma O-PDX for the synaptophysin (SYP) gene (RNA-seq FPKM=53 in neuroblastoma but <1.0 for other tumor types). The chromHMM states for each region of the gene are indicated below the ChIP-seq peaks, and the scale for the ChIP-seq is indicated on the right of each track. The 2 states that are the highest proportion are full-height bars, and the remaining 9 states are half height. The intensity of each bar is proportional to the percentage of each state across all samples for that gene. For the bars that are half the height, the intensity is scaled, starting at 50% of maximum intensity. (c) Stack histogram of the percentage of each of the 16 chromHMM states for the genes expressed specifically in osteosarcoma across the 3 tumor types (OS, NB, RMS). (d) ChromHMM and expression of a gene (SP7) that is specifically expressed in osteosarcoma. (e,f) ChIP-seq peaks for all 12 antibodies for the SP7 promoter in osteosarcoma and rhabdomyosarcoma O-PDXs. Abbreviations: chromHMM, chromatin Hidden Markov Modeling; NB, neuroblastoma; OS, osteosarcoma; RMS, rhabdomyosarcoma.