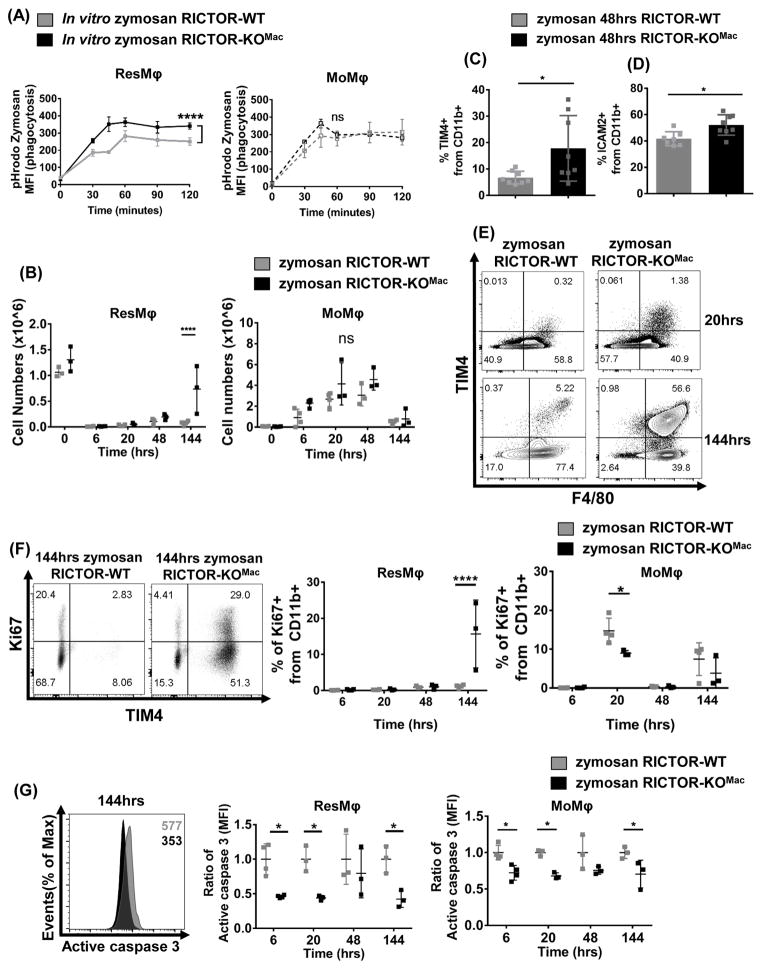
Figure 4. mTORC2 deficiency enhances phagocytosis and promotes tissue-resident macrophages during resolution phase in zymosan induced peritonitis.
(A) Peritoneal exudate cells (1 × 10⁵) from naïve RICTOR-WT and RICTOR-KOMac were incubated with pH sensitive dye (pHrodo fluorescence) labeled zymosan bioparticles for indicated time. At each time point, cells were fixed and stained, then analyzed by flow cytometry. MFI of pHrodo+ ResMφ (CD11b+TIM4+F4/80hi) (Left) and MoMφ (CD11b+TIM4−F4/80lo) data (Right) (N=5/group). (B–G) RICTOR-WT and RICTOR-KOMac were injected IP with Zymosan A (0.1mg/mouse). After indicated time, peritoneal exudate cells were harvested and phenotypes were analyzed via flow cytometry. (B) Numbers of ResMφ (CD11b+TIM4+F4/80hi) and MoMφ (CD11b+TIM4−F4/80lo) after zymosan injection. (C) Percentage of TIM4+ cells and (D) ICAM2+ cells from CD11b+ population at 48hrs. (E) Representative flow plot of TIM4 and F4/80 expression from CD11b+ population at 20 and 144hrs. (F) Representative flow plot of Ki67 and TIM4 expression from CD11b+ population after 144hrs, and statistical analysis of Ki67+ cells from ResMφ (CD11b+TIM4+F4/80hi) and MoMφ (CD11b+TIM4−F4/80lo) (G) Representative histogram plot of active caspase 3 after 144hrs and analysis of active caspase 3 based on MFI from ResMφ (CD11b+TIM4+F4/80hi) and MoMφ (CD11b+TIM4−F4/80lo). Data are representative of at least three independent experiments. Mean±SD, N=3–5, Statistical significance were determined by two-way ANOVA with Bonferroni post-test, **p< 0.01, ****P < 0.0001

